Overview:
Cytochromes P450 (CYPs) are enzymes that utilize heme as a cofactor to catalyze monooxygenase reactions. They belong to a superfamily of enzymes that have been identified in all kingdoms of life, including plants, animals, fungi, protists, bacteria, archaea, and even viruses. P450s are known for their remarkable ability to catalyze over 20 types of oxido-reduction reactions, making them "Nature's Most Versatile Biological Catalysts." However, despite the existence of more than 300,000 P450 genes in different databases, less than 0.2% of them have been functionally characterized.
Building upon our previous work, we proudly present P450Rdb v2.0, a significantly expanded and deeply annotated resource of literature-supported P450 reactions. Compared to the first version (which contained 1,600 reactions, 600 P450s, and 200 species), the current 2.0 database catalogs 3,821 reactions involving 1,012 P450 enzymes across 374 species. Beyond merely expanding the dataset, v2.0 features a major leap in data depth: approximately 50% of the entries have been upgraded to include complete sets of substrates and products for the reactions, and around 30% are enriched with detailed experimental reaction conditions.
Crucially, v2.0 introduces two major functional upgrades. The first is a Reaction Cascade module for visualizing multi-step metabolic networks. The second is an Enzyme-Substrate Prediction (ESP) model—a binary classifier specifically fine-tuned on our entire curated dataset to evaluate potential catalytic interactions. By empowering this comprehensive database with advanced AI tools, we aim to facilitate the discovery of new P450 functions, the design of novel drugs, and the development of cutting-edge biotechnologies.
The homepage interface is displayed in Fig 1-1:
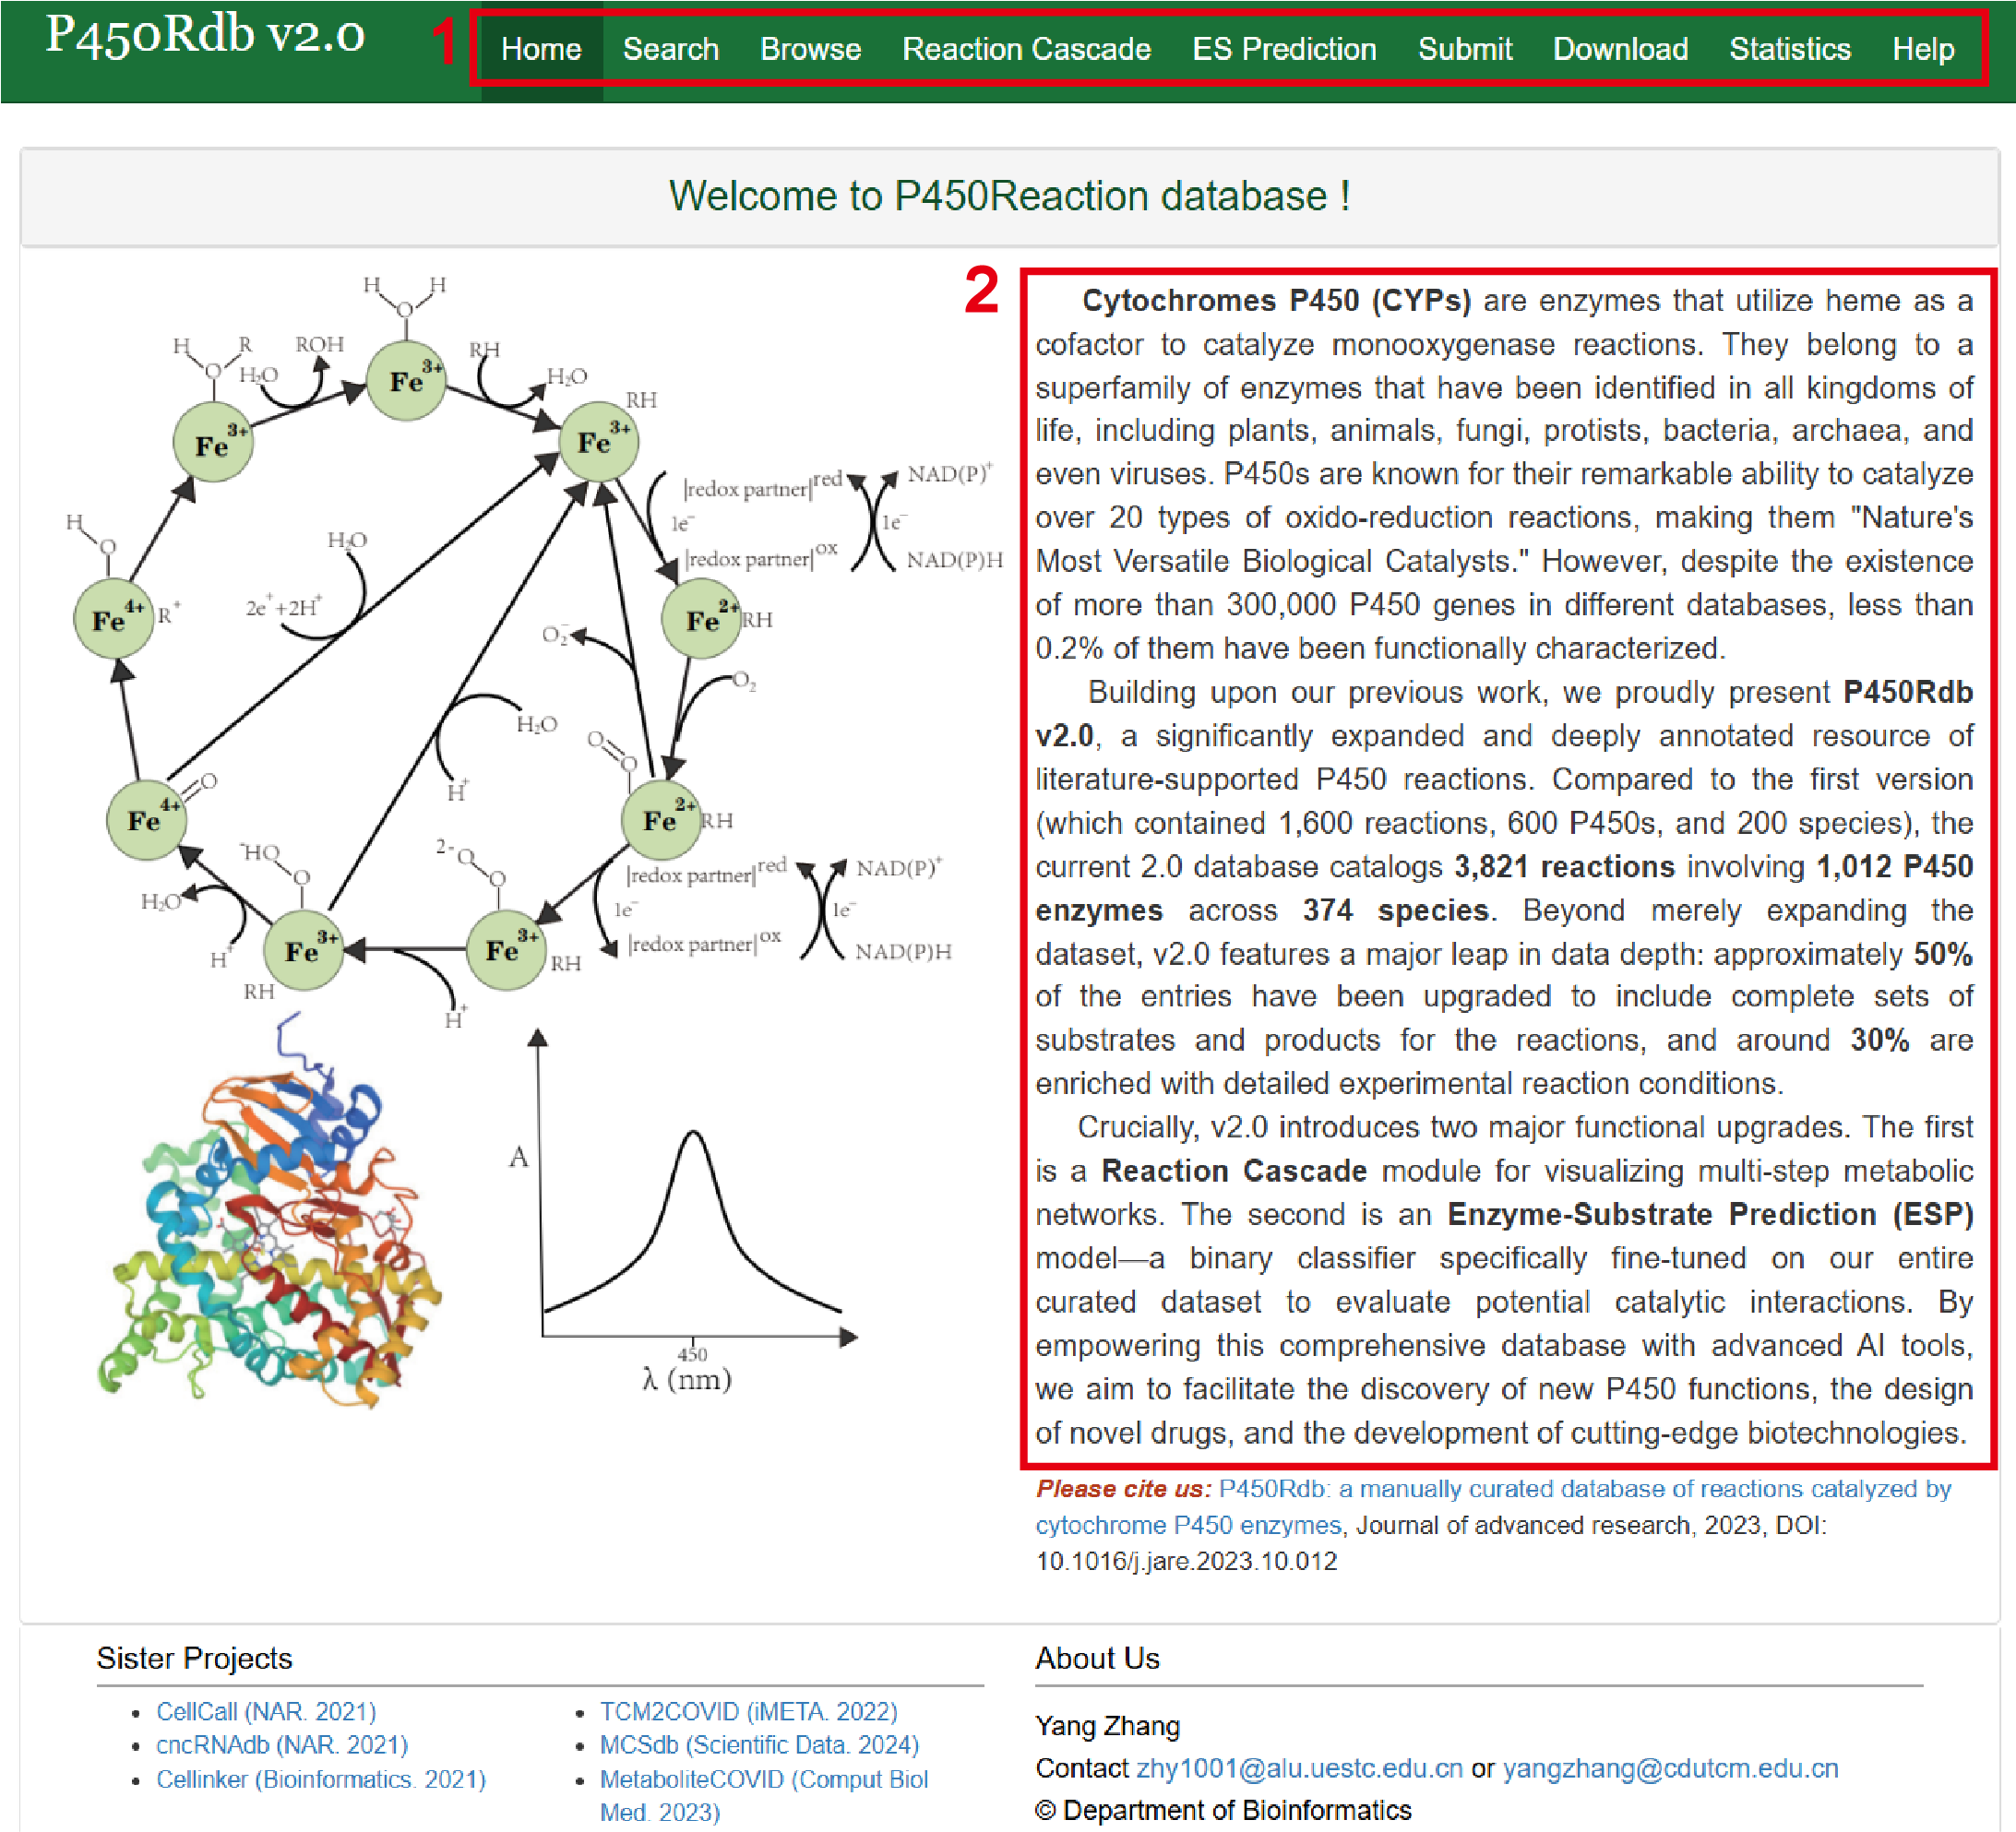
Fig 1-1
- Global Navigation Bar: Access all primary modules (Home, Search, Browse, Reaction Cascade, ES Prediction, Submit, Download, Statistics, Help) via a clean, compact menu bar.
- Database Summary & Introduction: A comprehensive scientific introduction and updated data scale of the current version.
Version 2.0 upgrades the Search module into a multi-tab search suite, supporting multi-dimensional text queries and advanced chemical structure retrieval modes to accommodate diverse chemoinformatics inputs.
1. Basic Search (Fig 2-1):
- Geared toward protein-centric retrieval.
- Users can query the system using P450 Symbols (e.g., CYP97C11), UniProt IDs (e.g., D2CV78), or NCBI Gene IDs (e.g., 100322877).
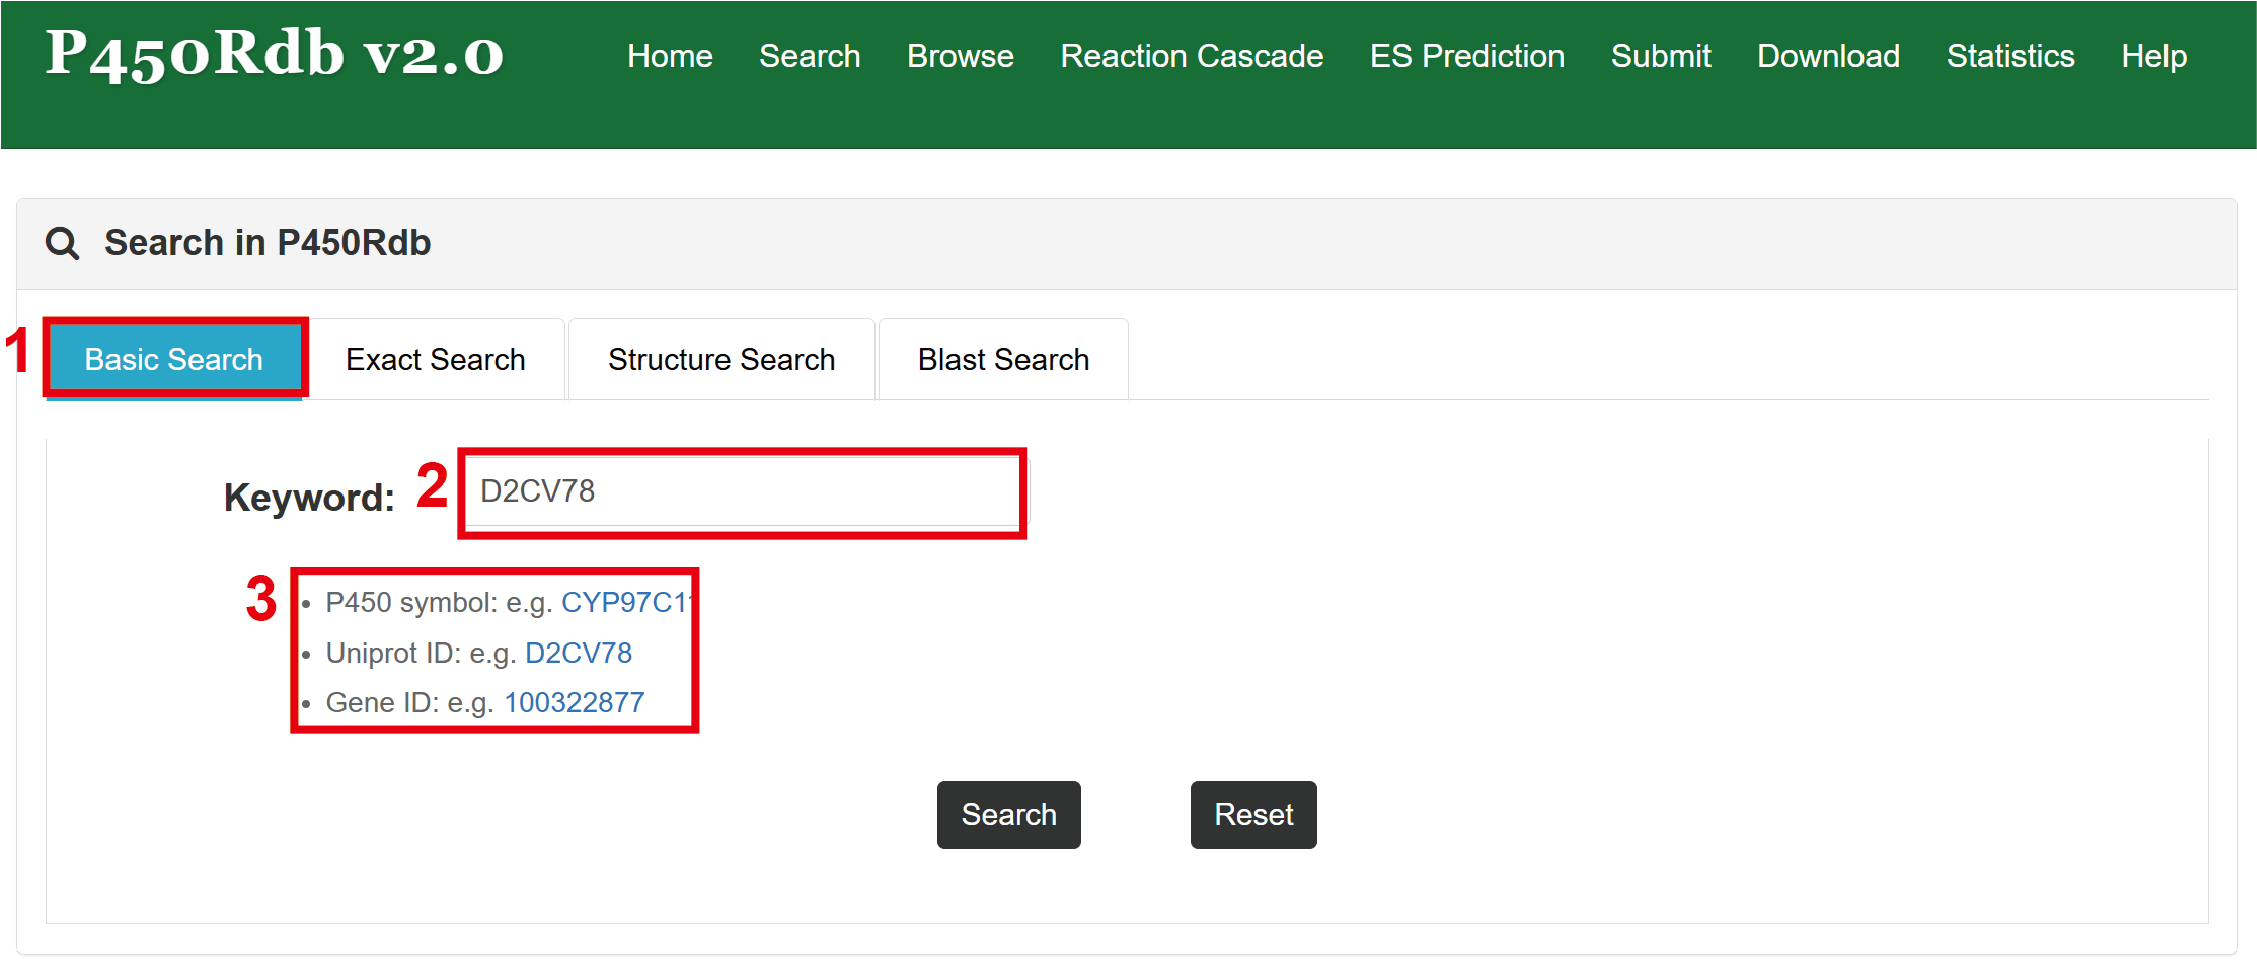
Fig 2-1
2. Exact Search (Fig 2-2):
- Geared toward chemical-centric queries.
- Users can search for specific compounds by Substrate Name (e.g., Zeinoxanthin), PubChem CID (e.g., 5281234), or Chemical Formula (e.g., C40H56O).
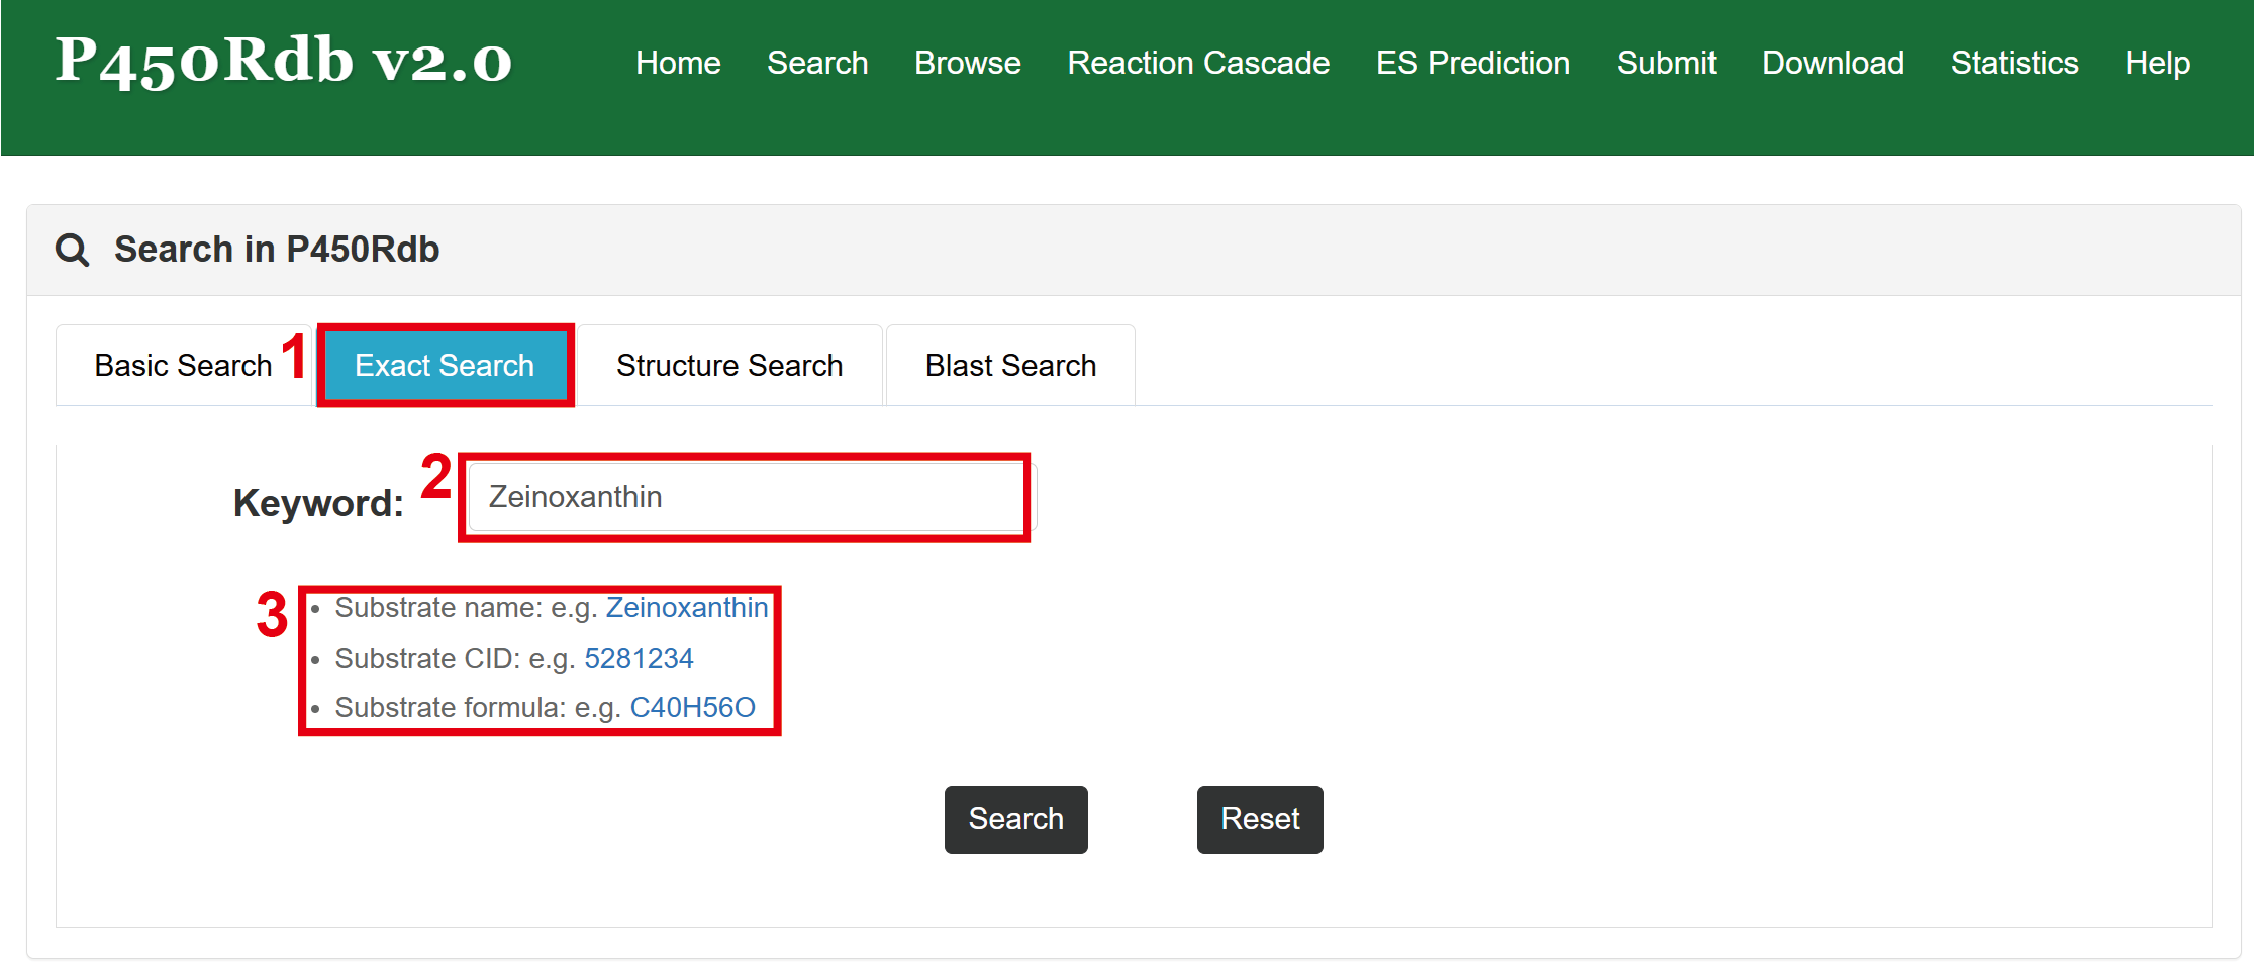
Fig 2-2
3. Structure Search (SMILES) (Fig 2-3):
- Enables exact molecular framework searching via SMILES nomenclature.
- Users can copy-paste a raw SMILES string directly into the input field or click the "Draw Structure" button to open an embedded molecular sketcher (Ketcher).
- A real-time Structure Preview canvas renders the 2D coordinate map of the molecule instantly upon validation.
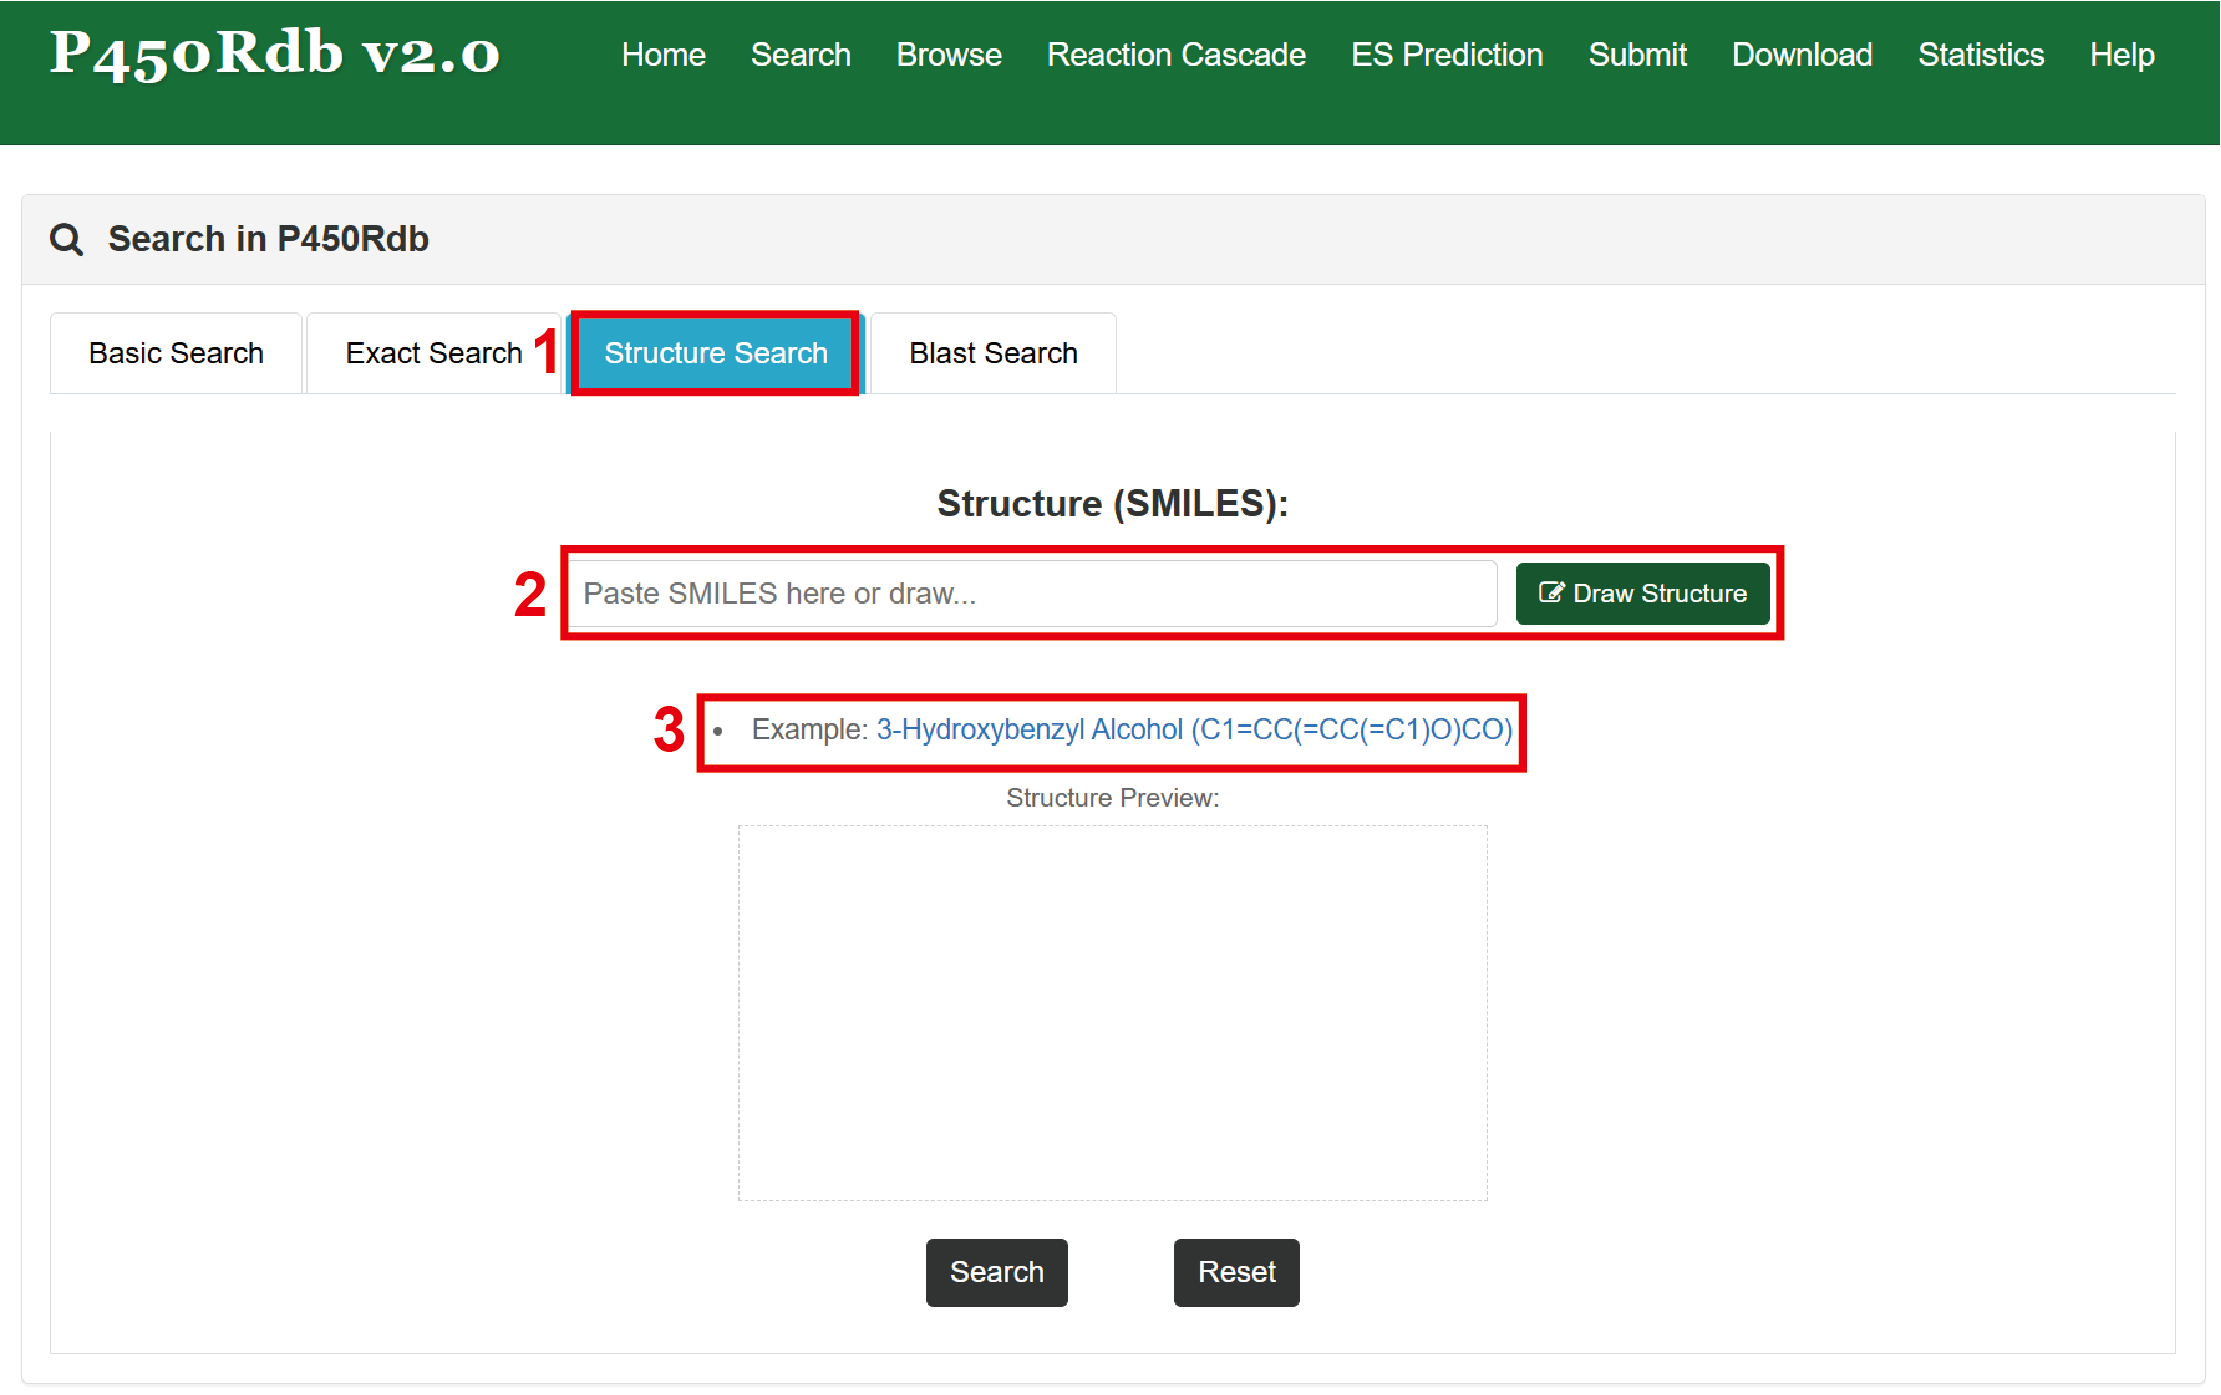
Fig 2-3
When dealing with newly sequenced or uncharacterized proteins/nucleotides, users can execute local sequence alignments against our curated database of functionally validated P450 sequences to predict potential catalytic roles.
1. Input and Execution Operations (Fig 3-1):
- Select Alignment Mode: Pick the appropriate alignment tool from the dropdown menu — BLASTP (Protein query vs. Protein database) or BLASTX (Nucleotide query translation vs. Protein database).
- Set Maximum Target Hits: Define the maximum number of aligned rows to retrieve and render in the final results.
- Input Sequence & Examples: Paste the target sequence in standard FASTA format into the text area. Fast-load helper buttons are equipped for quick testing.
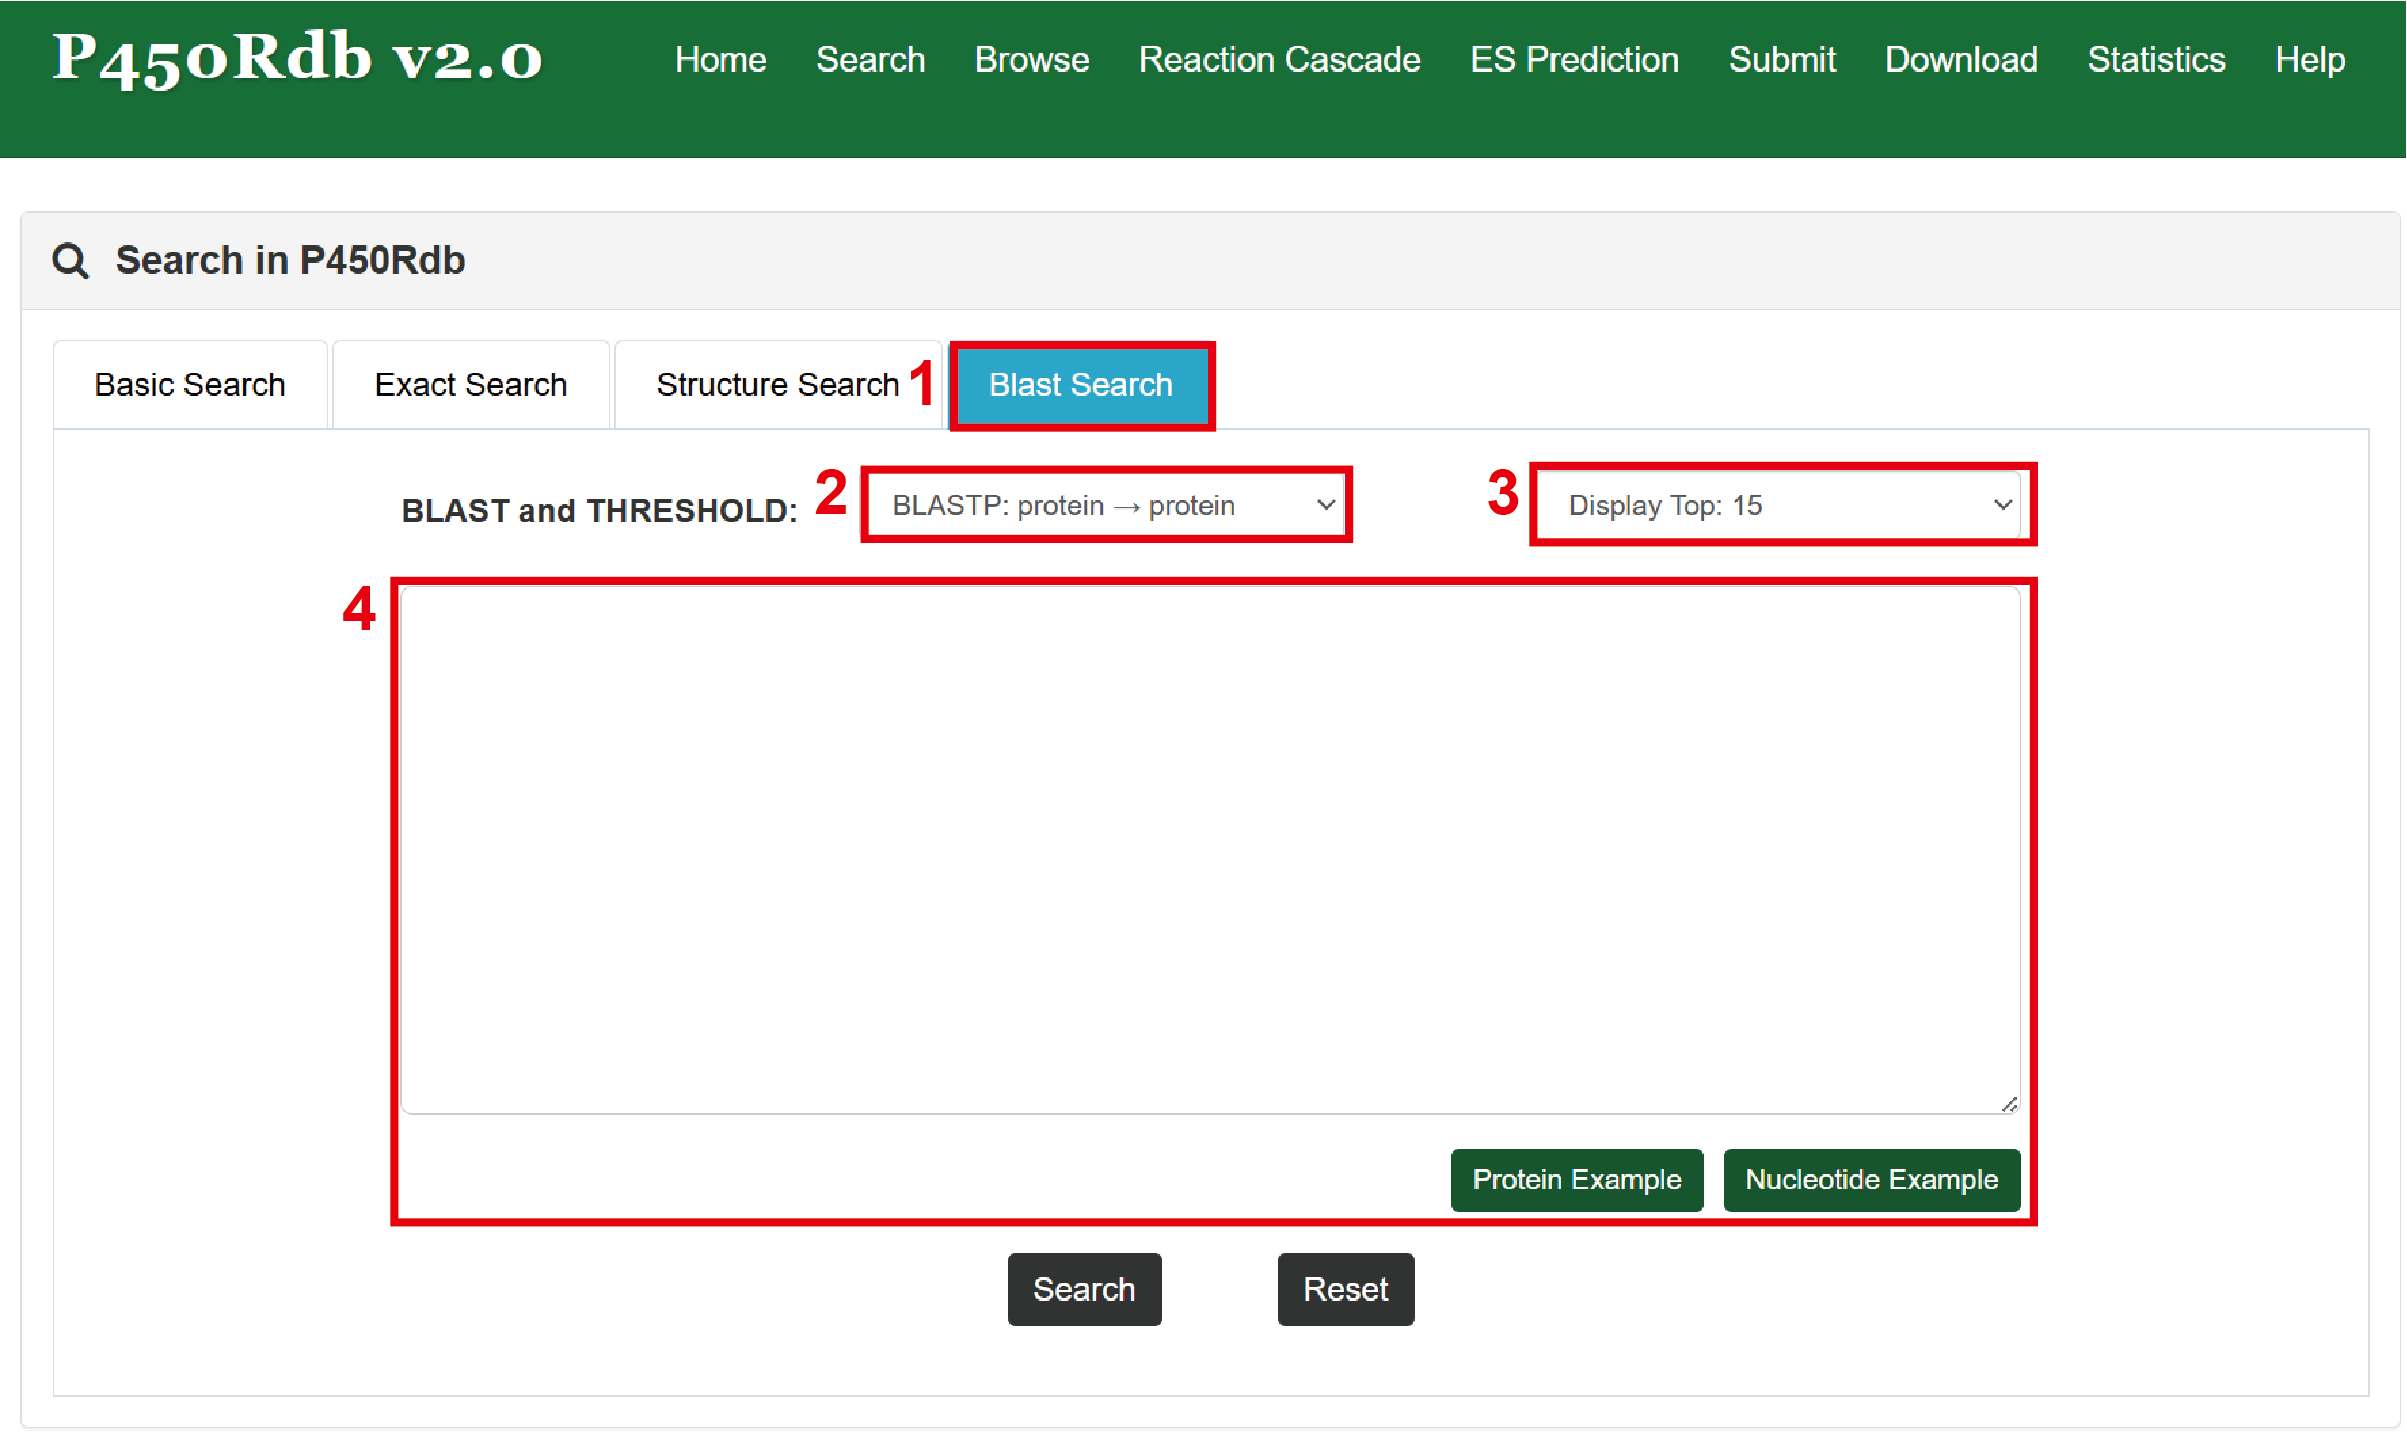
Fig 3-1
2. Results Evaluation Matrix (Fig 3-2):
After execution, the system returns a tabular result matrix ranked automatically by evolutionary similarity.
- Core Alignment Metrics (Boxed in Red 1 & 2):
- Identity (%): The percentage of exact residue matches, indicating structural similarity.
- E-value: The Expectation value; approaching 0.0 indicates absolute evolutionary homology.
- Bit-score: Higher values reflect stronger sequence and structural alignment.
- Downstream Exploration: The table provides matching P450 annotations. Clicking the "more" token redirects the user directly to the comprehensive Reaction Detail Page.
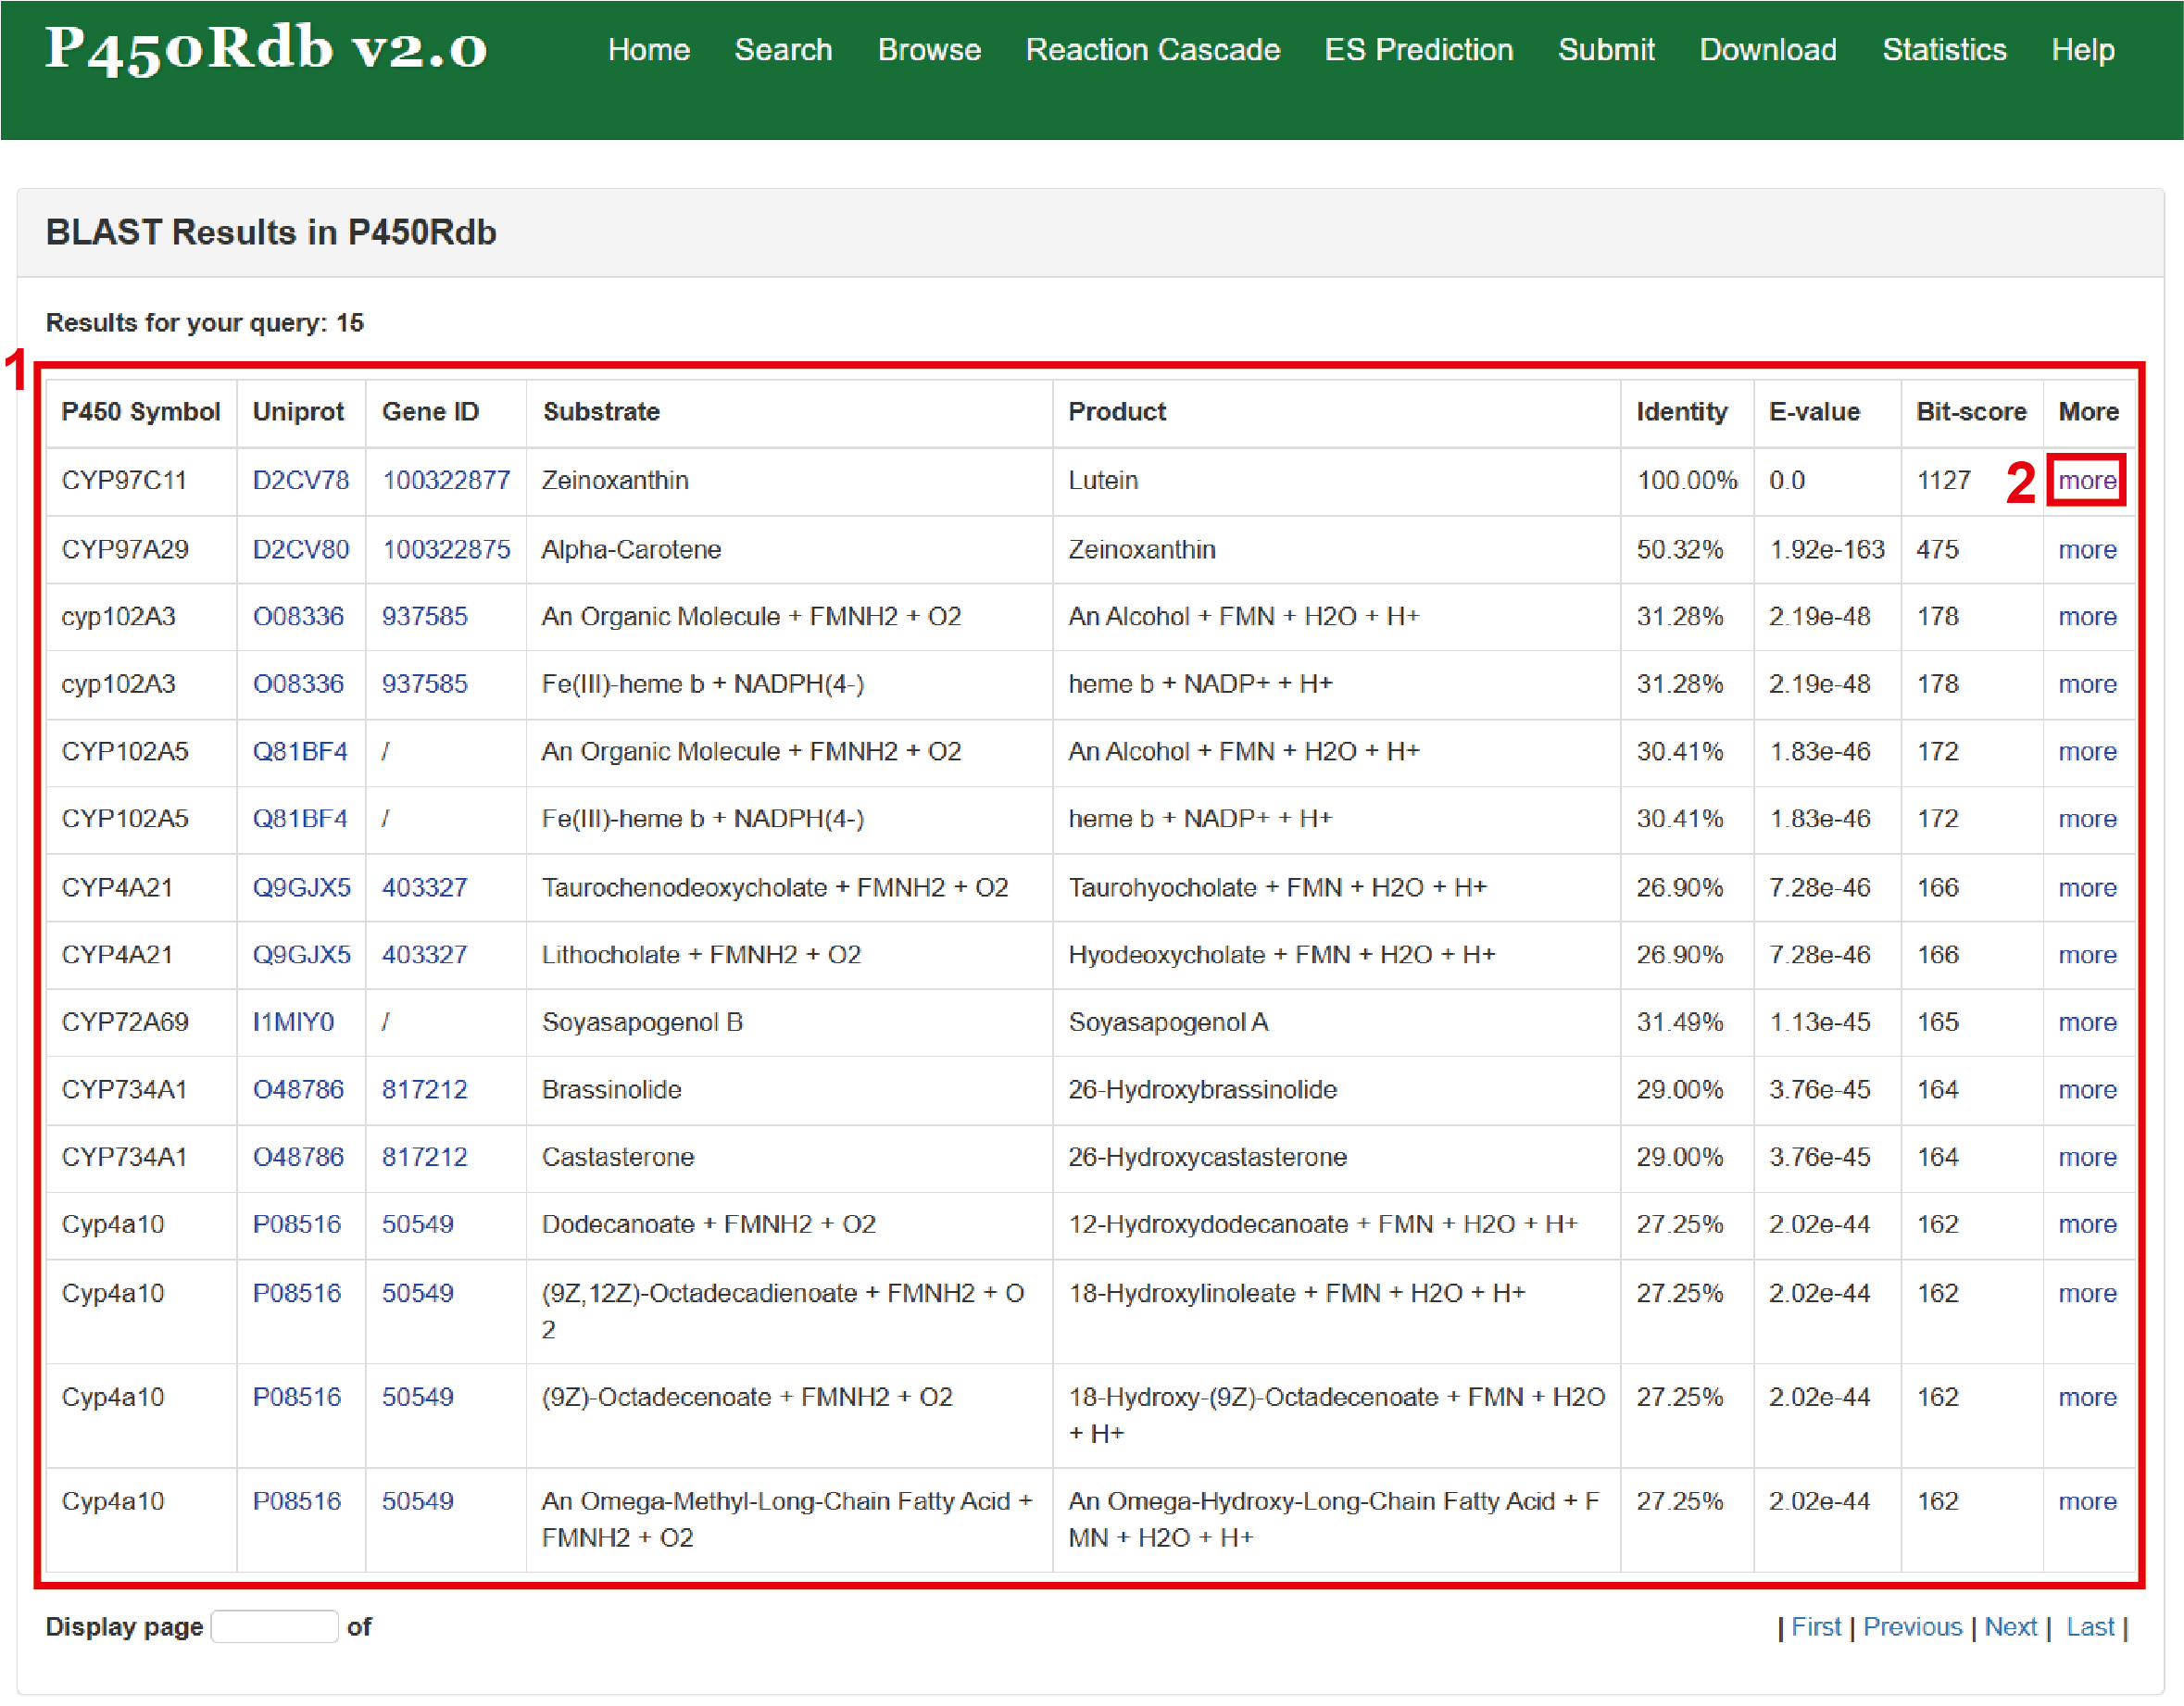
Fig 3-2
For users intending to scan the entire landscape of P450 catalytic properties without prior keywords, the Browse engine implements a structured hierarchical matrix.
Filtering Dimensions and Operation (Fig 4-1):
- Species Classification (Boxed in Red 1): Filter reactions by major taxonomical kingdoms (Plant, Animal, or Microorganism).
- Reaction Type Ontology (Boxed in Red 2): Reaction types are divided into 11 categories: Oxidation, Cyclization, Demethylation, Decomposition, Rearrangement, Elimination, Decarboxylation, Reduction, Organic Coupling, Dimerization, and Hydrolysis.
- Chemical Bond Specificity (Boxed in Red 3): Filter down to highly specific sub-categories based on the targeted reactive functional group (e.g., CH, C=C, C-O cleavage).
- Result Records & Downstream Entry (Boxed in Red 4 & 5): Displays the total count of matched records. Click "Apply Filter" to update the summary rows, and click "more" to jump to the details.
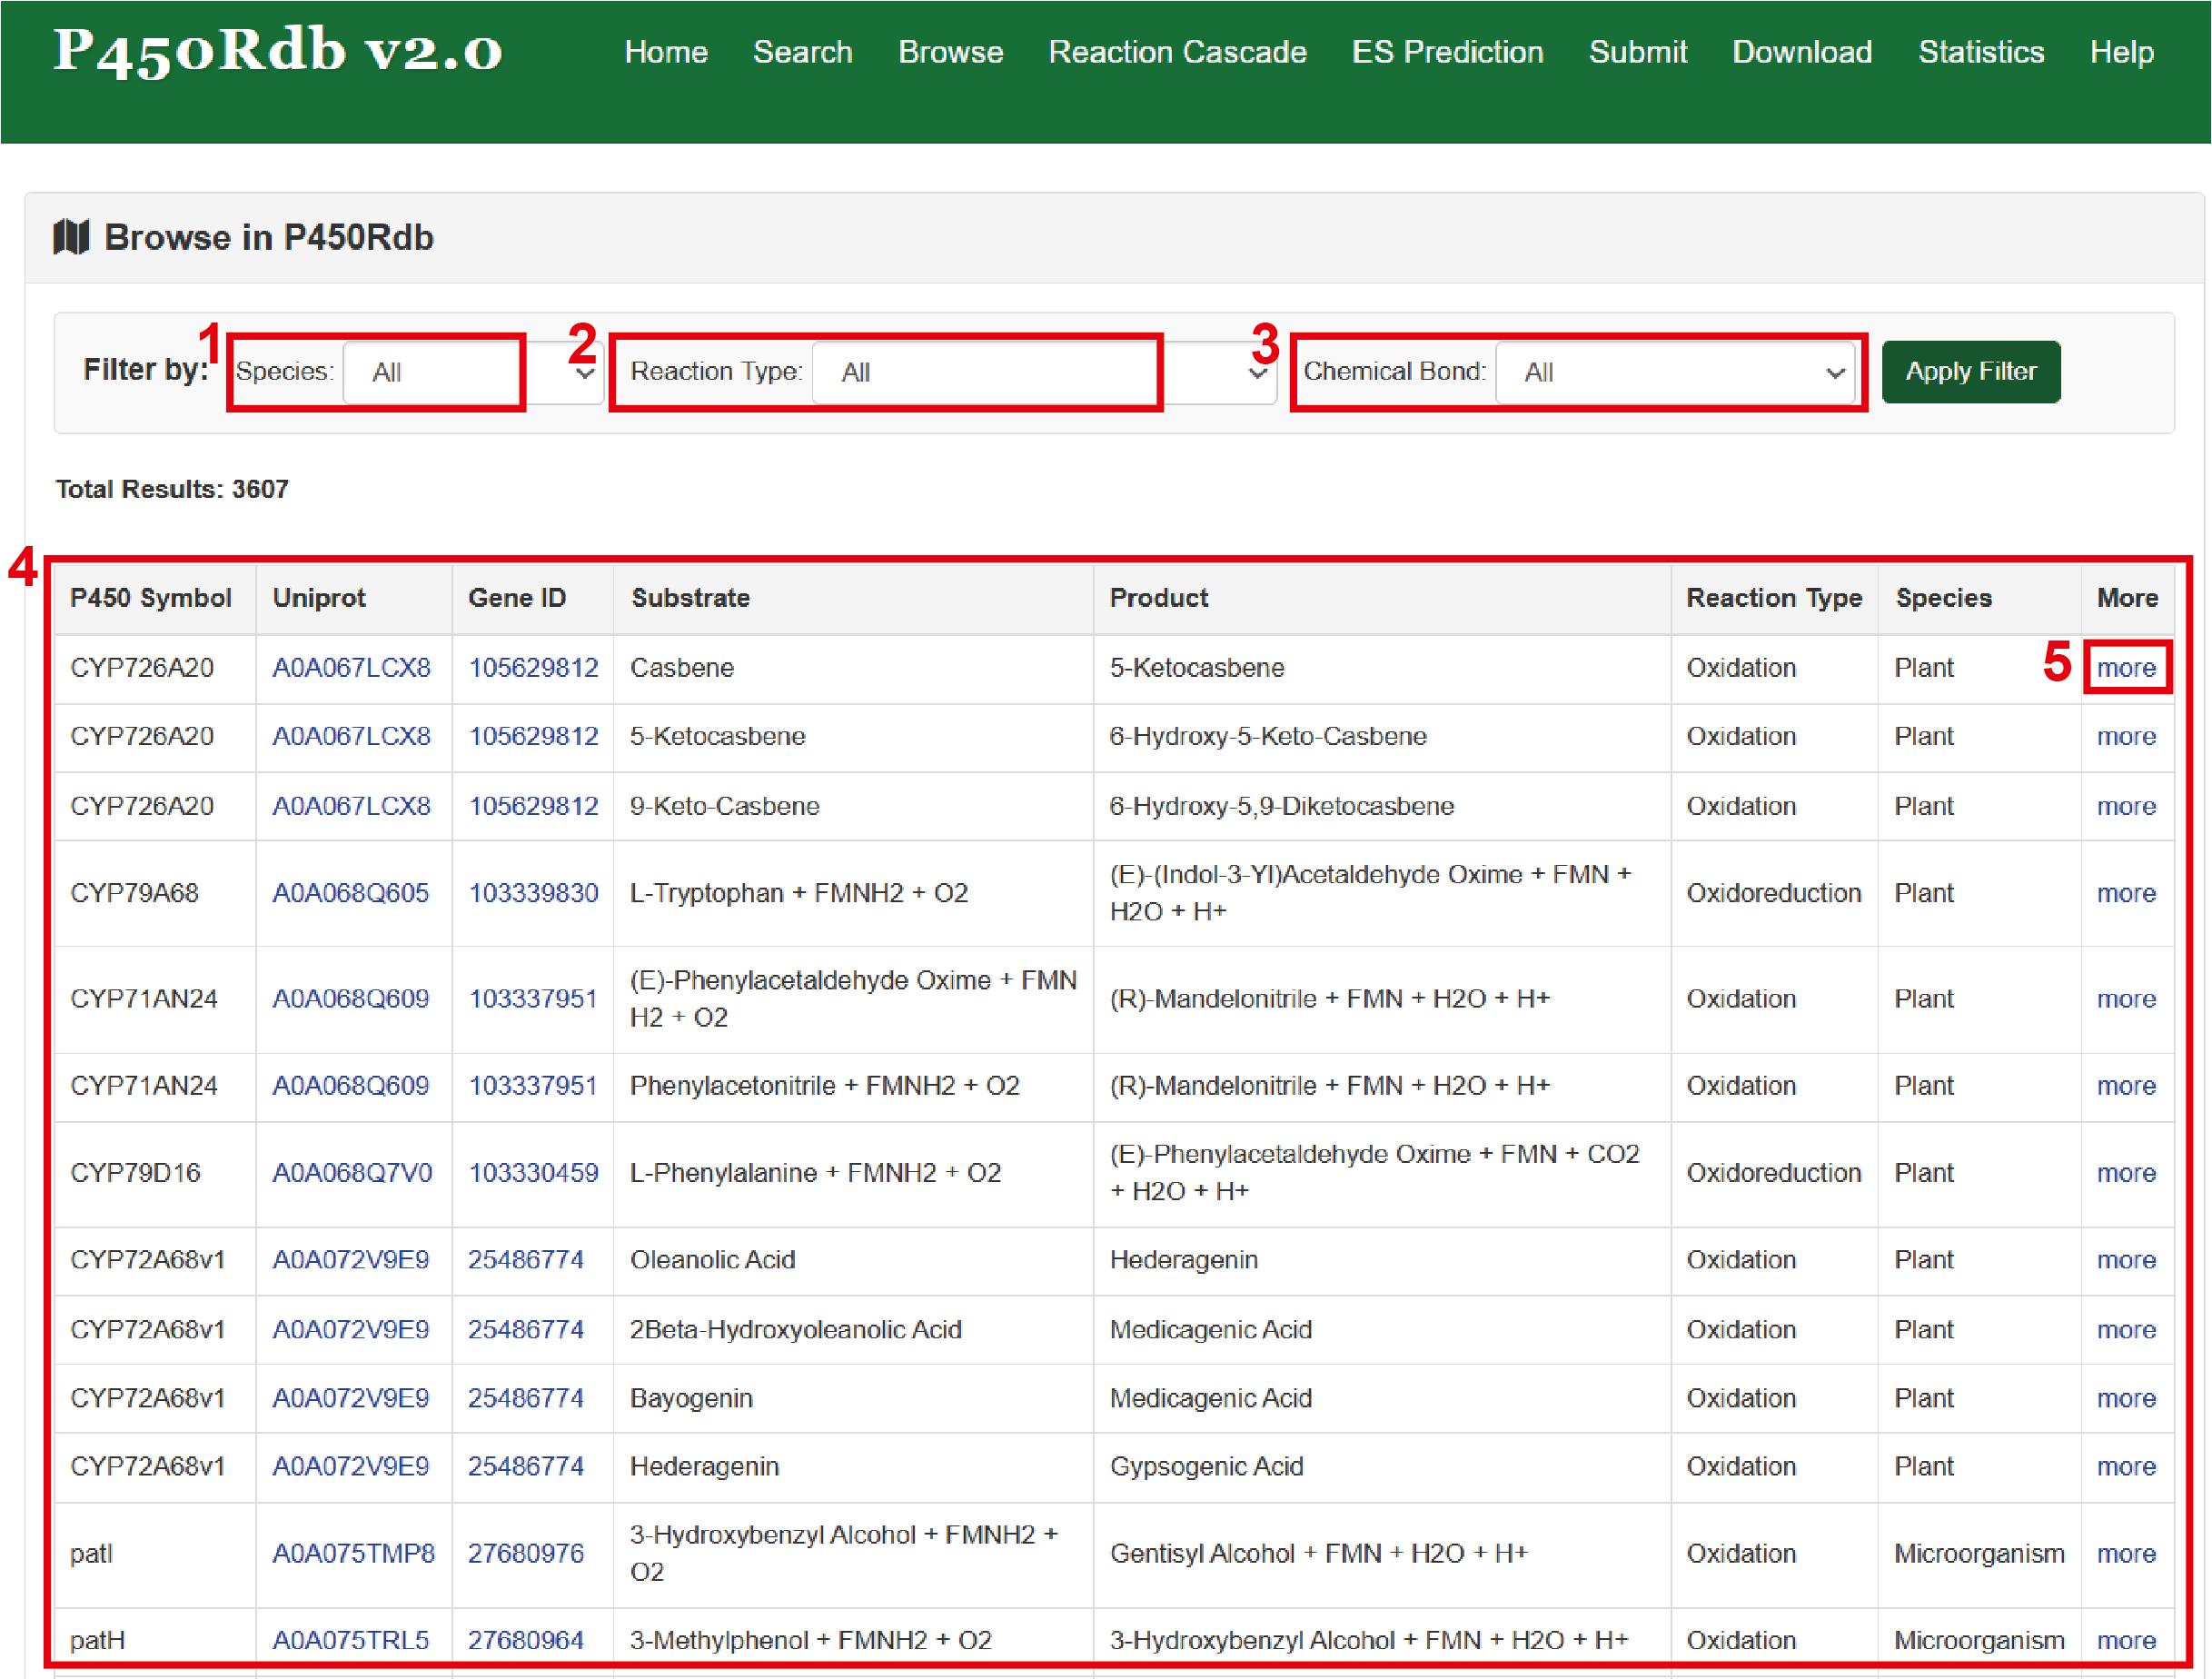
Fig 4-1
Clicking "more" from any result table opens a multi-layered annotation dashboard containing full biographical and structural records.
Layout and Content Blocks (Fig 5-1):
- P450 Protein Profile (Boxed in Red 1): Documents basic metadata and features an embedded interactive 3D protein structure viewer alongside the full raw Protein Sequence.
- Reaction Scheme (Boxed in Red 2): Details the specific metabolic parameters including the chemical conversion formula, reaction type (e.g., Oxidation), and targeted chemical bond, alongside a clear 2D visual transformation graphic.
- Substrate & Product Chemical Records (Boxed in Red 3 & 4): Provides rigorous chemoinformatics annotations for both sides of the equation, including Chemical Name, Formula, PubChem CID, SMILES, and 2D structure diagrams.
- Literature References (Boxed in Red 5): Lists the validated peer-reviewed publication supporting this record, showing the PMID, Article Title, Journal, and Year.
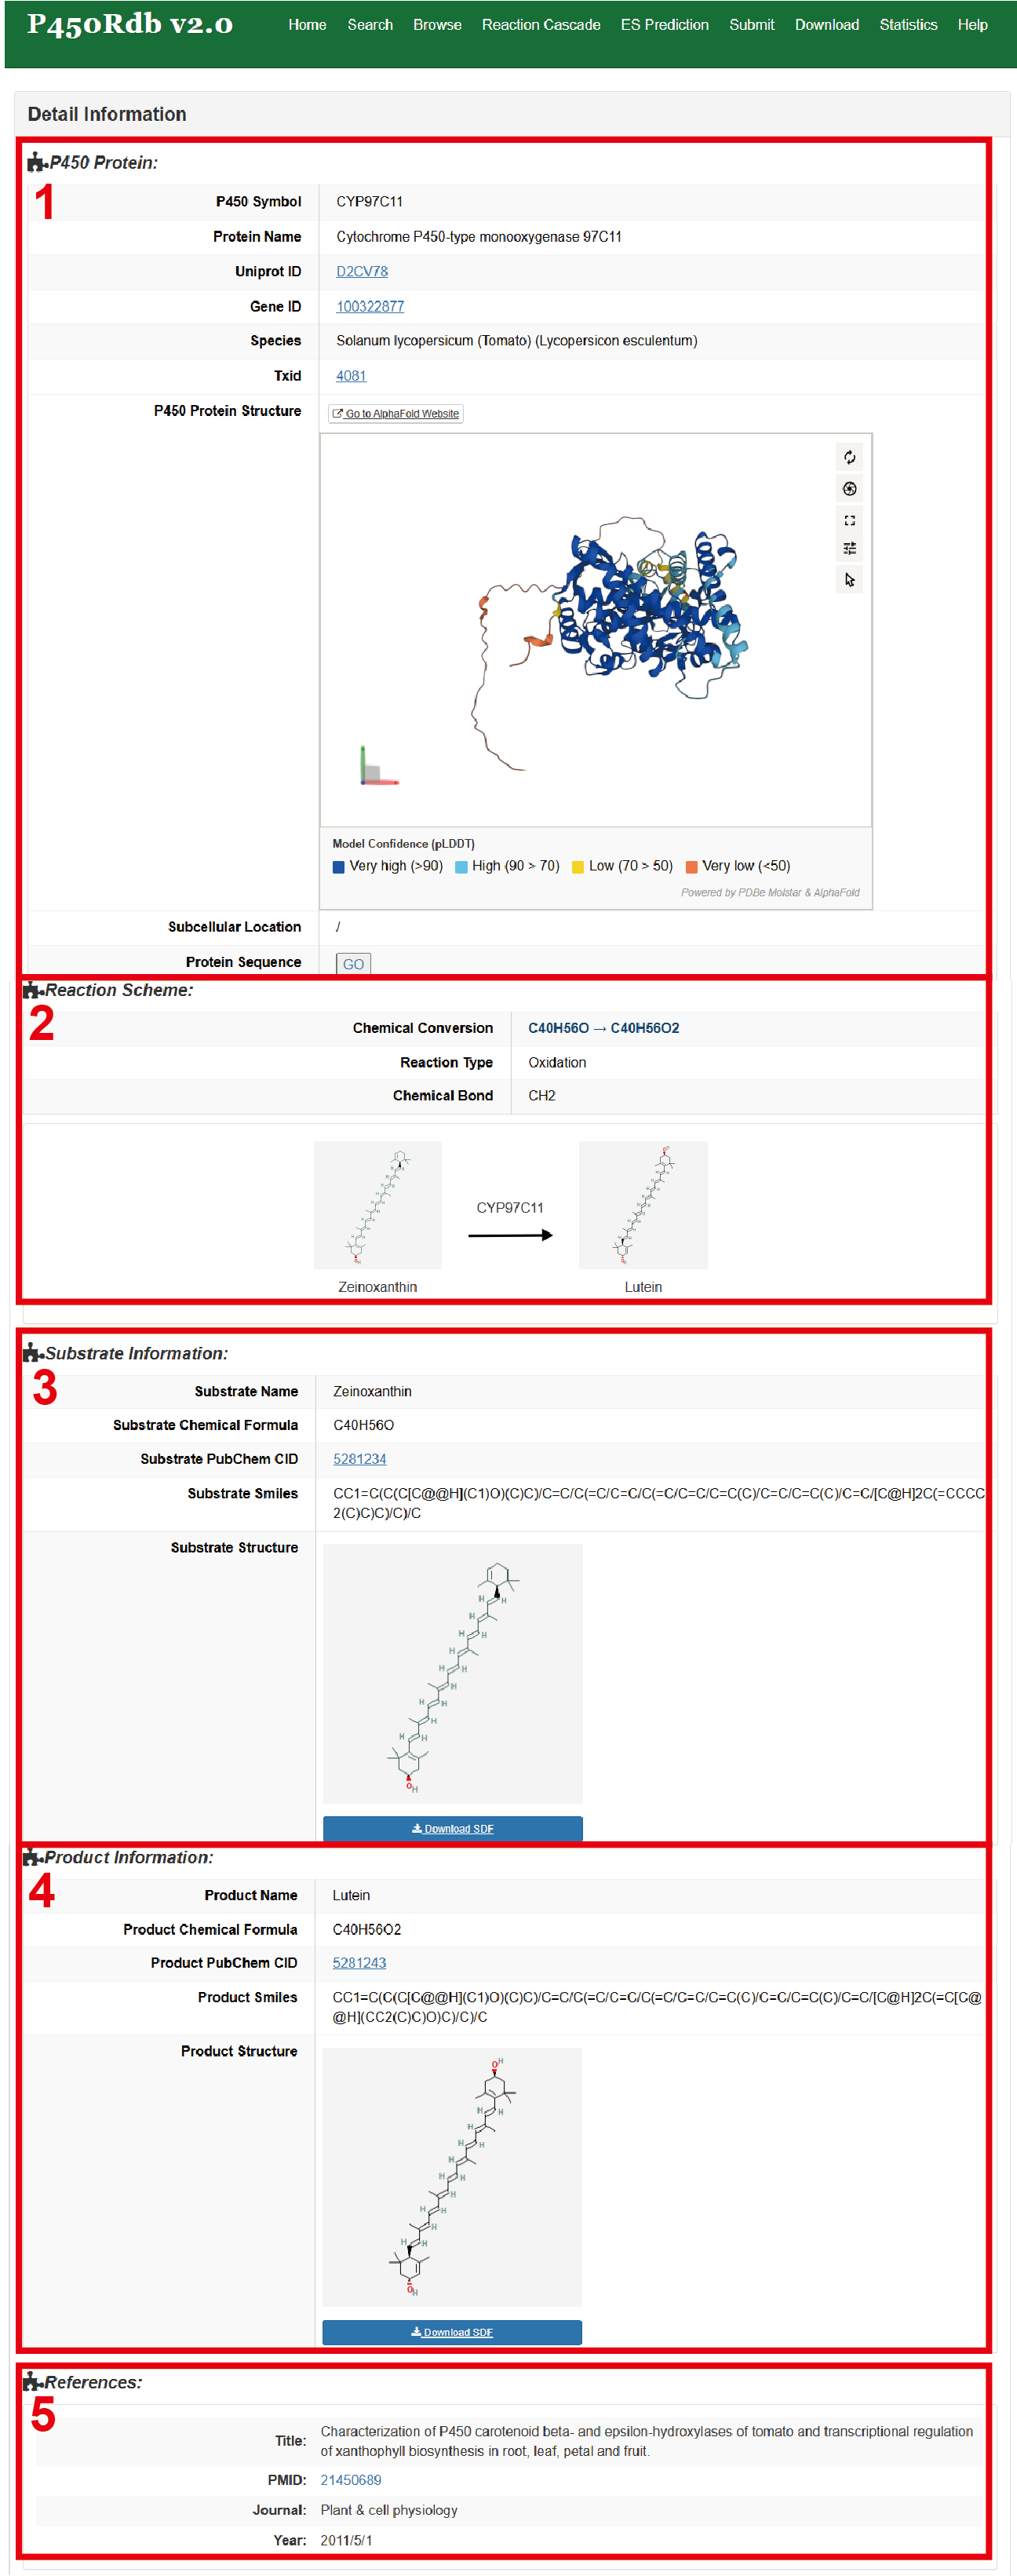
Fig 5-1
A major highlight of version 2.0 is the Reaction Cascade module, which transitions single-step reaction data into comprehensive, multi-step biotransformation network graphs.
1. Search Mode (Fig 6-1 & Fig 6-2):
- Compound Search (Fig 6-1): Query specific metabolic hubs by inputting exact text keywords (Substrate Name or PubChem CID).
- SMILES Structure (Fig 6-2): Trigger the network by providing chemical structures via pasting SMILES or drawing the molecule manually.
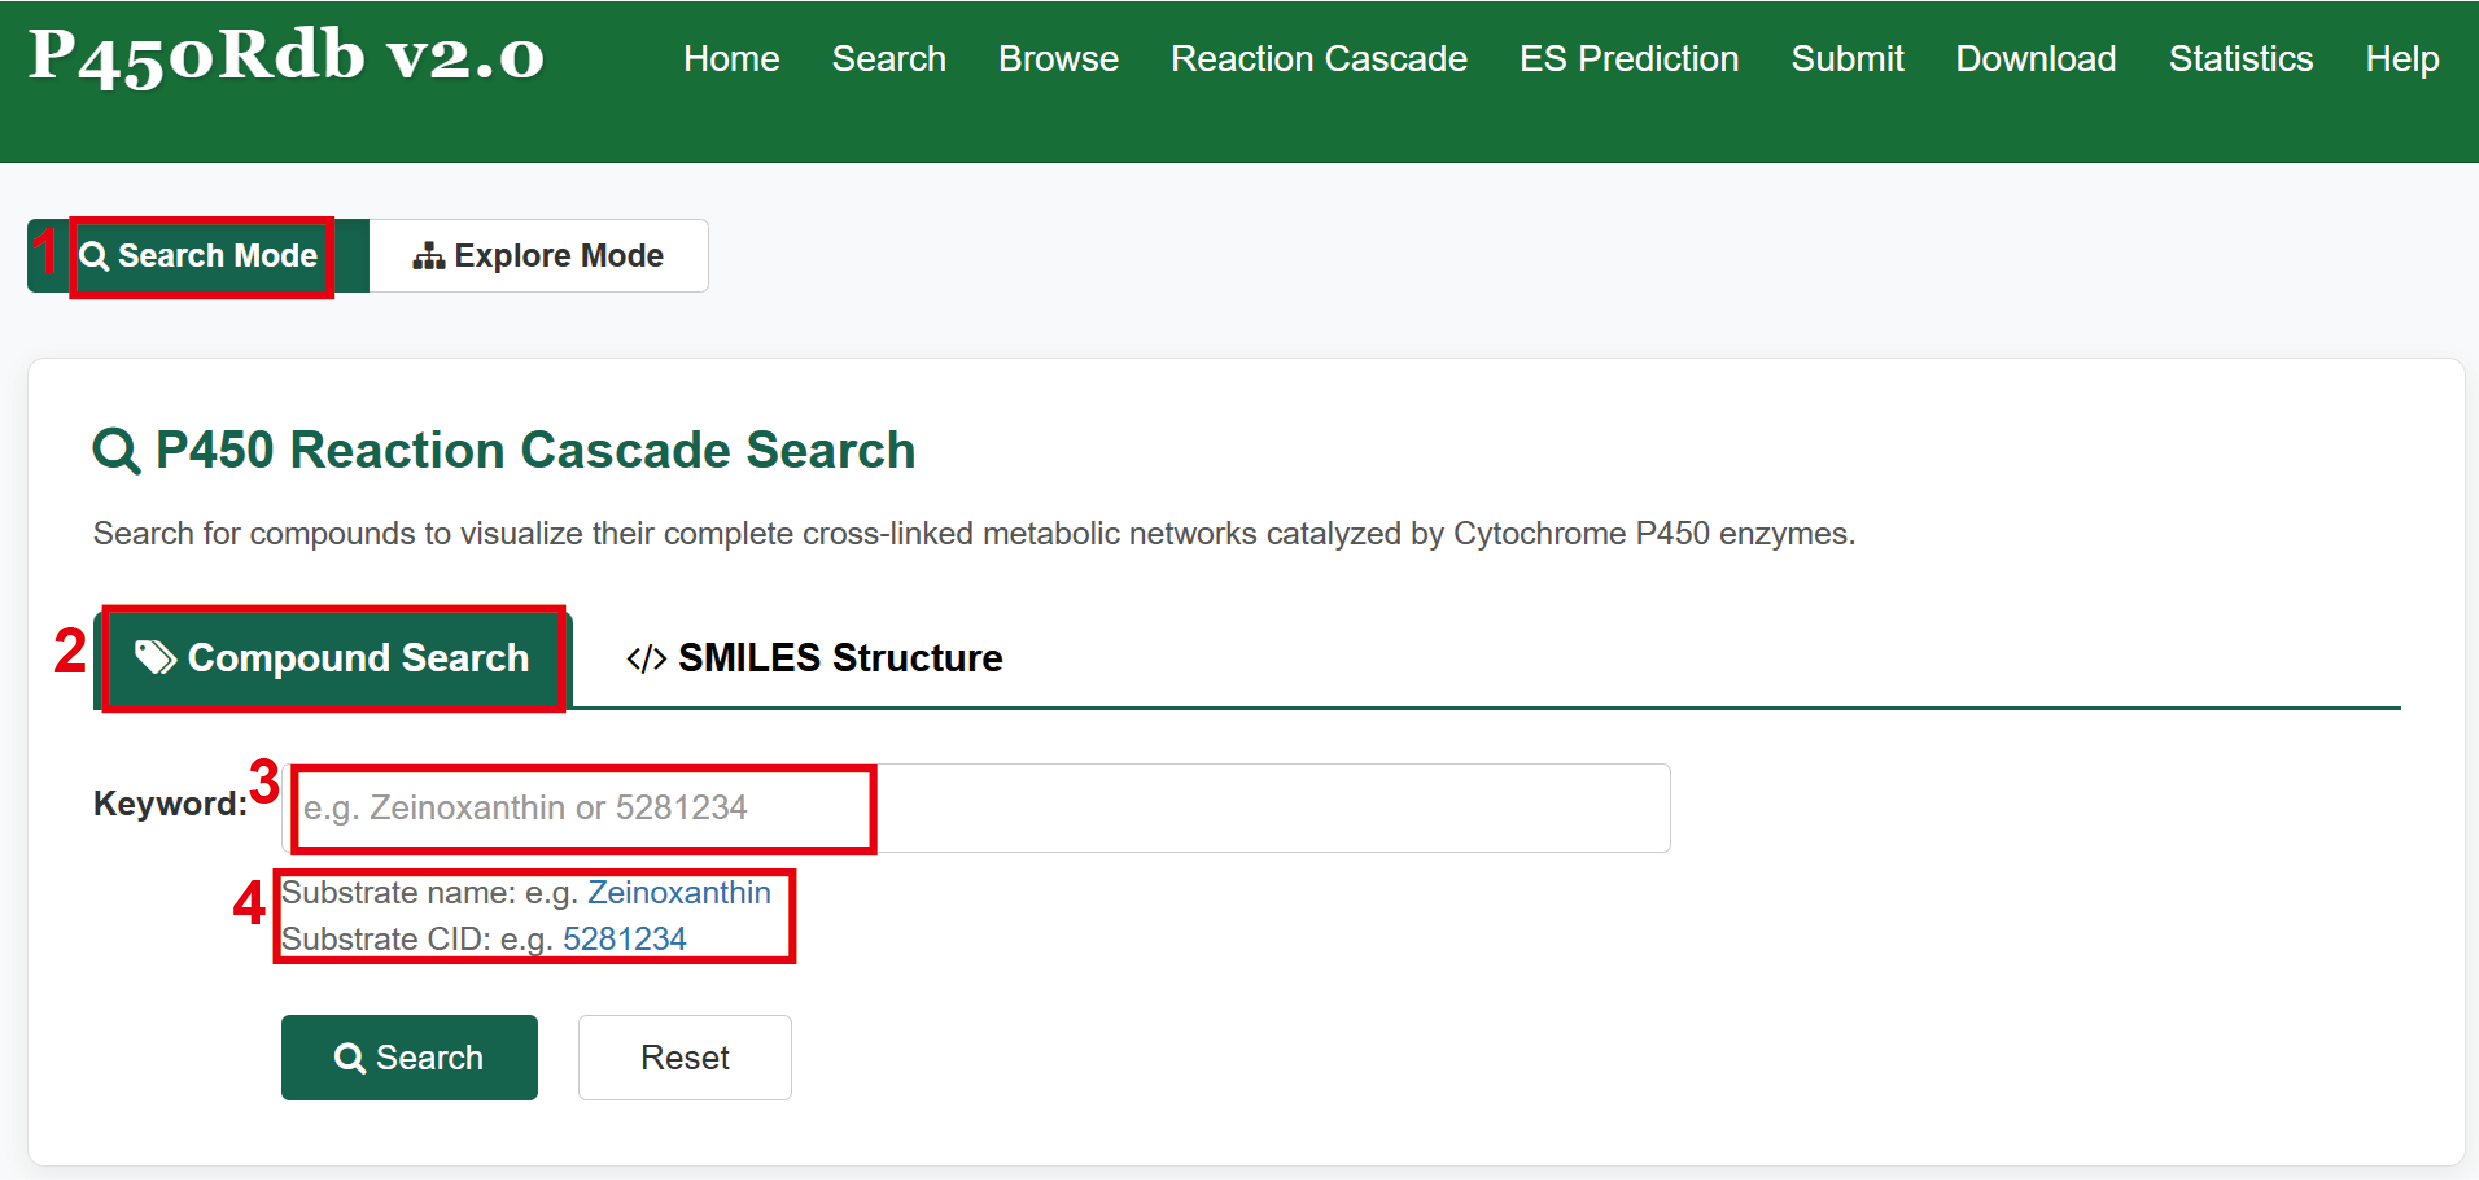
Fig 6-1
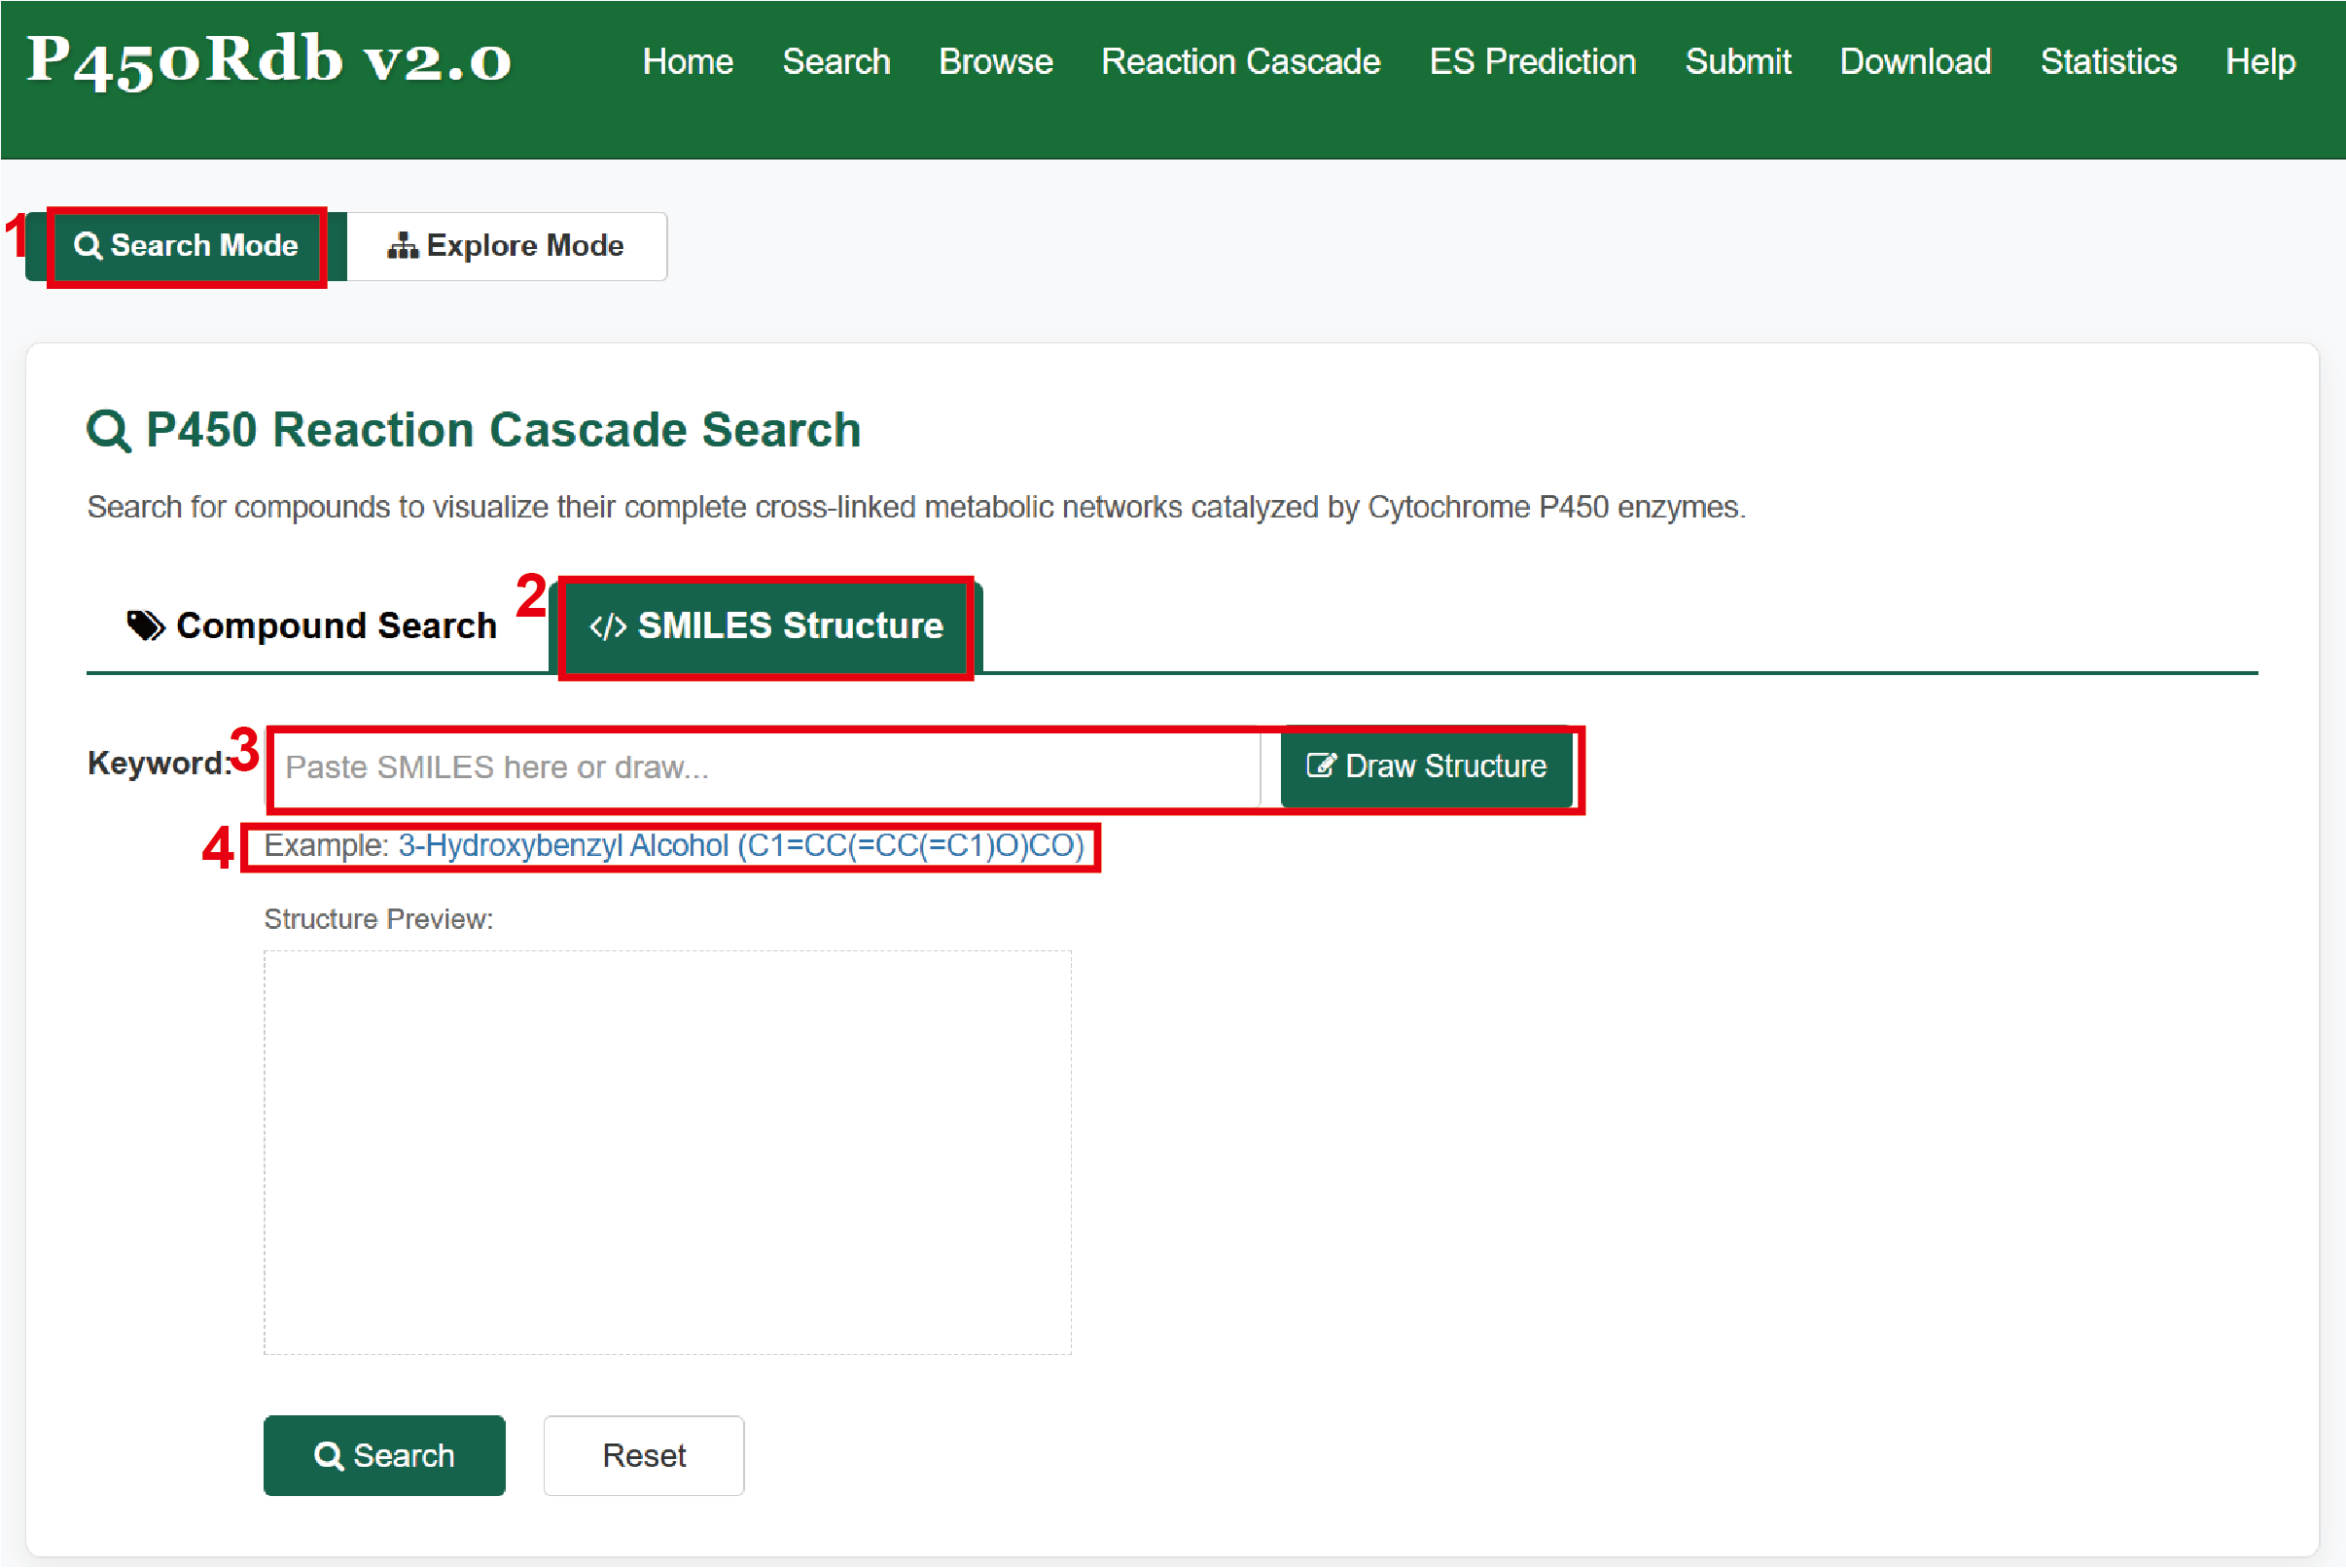
Fig 6-2
2. Explore Mode (Fig 6-3):
- A-Z Network Explorer: For macroscopic browsing, it provides a comprehensive A-Z directory containing every compound. Clicking any compound instantly renders its complete upstream and downstream metabolic family tree.
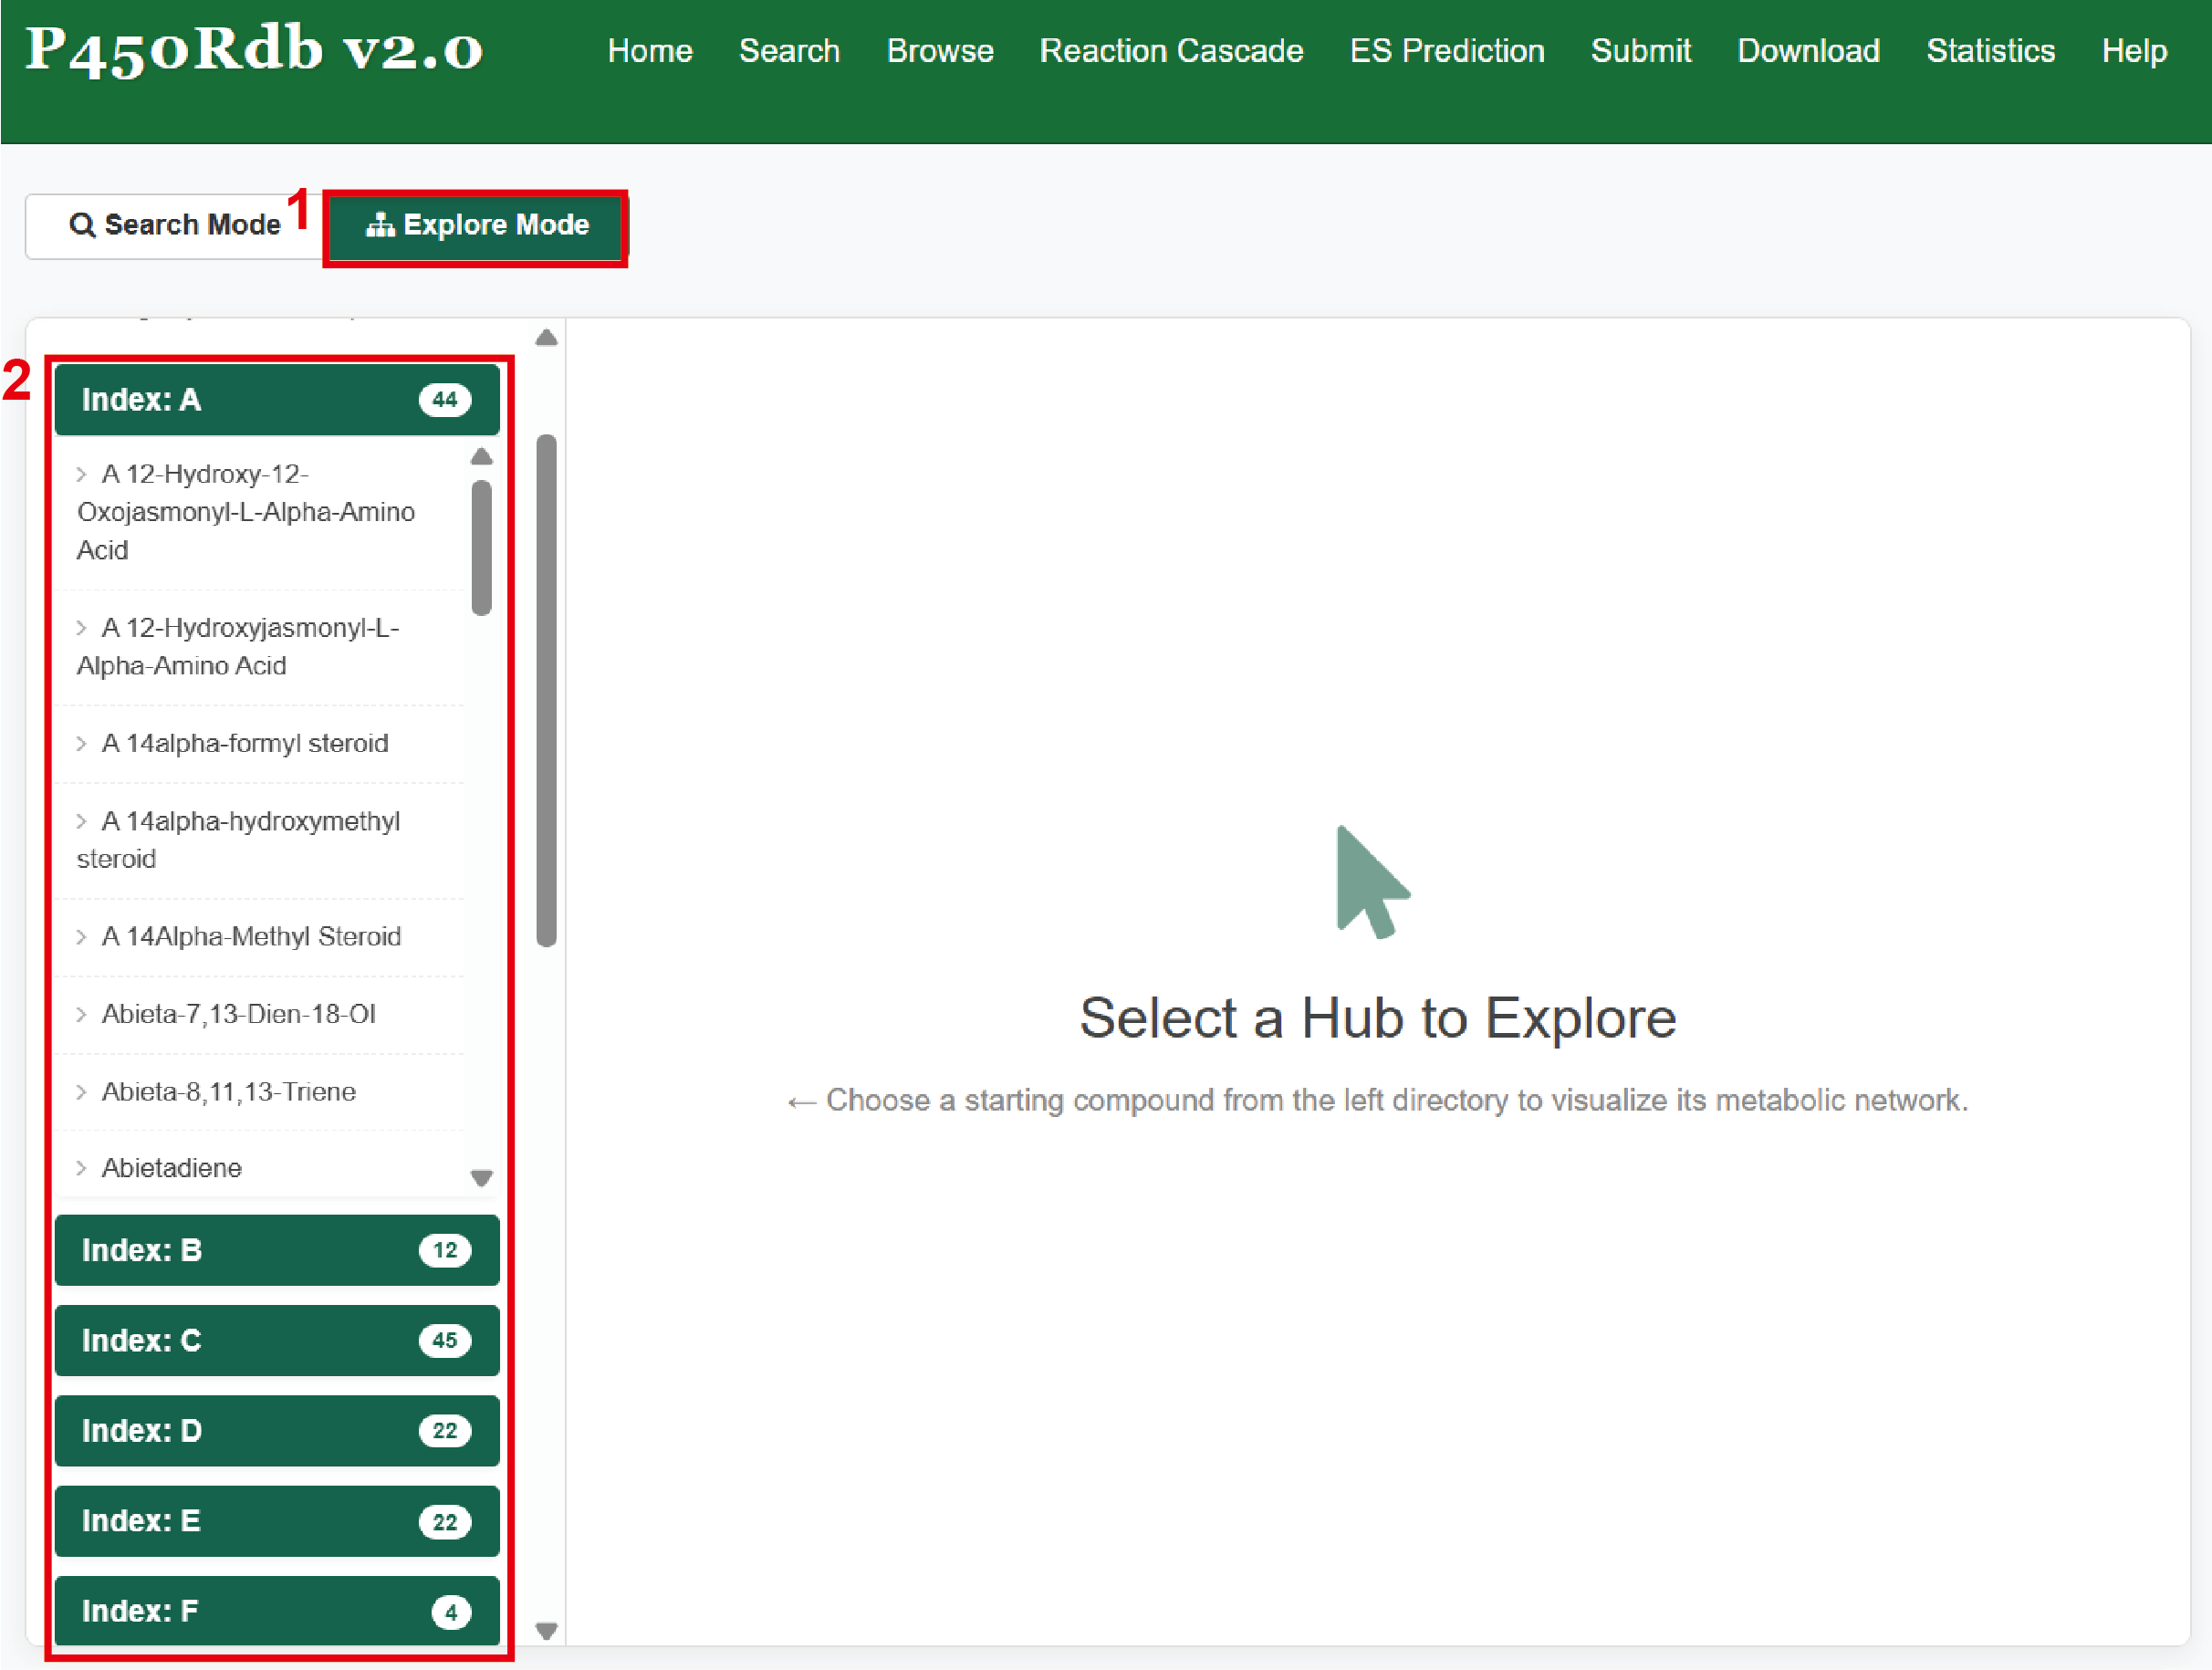
Fig 6-3
3. Network Visualization and Interpretation (Fig 6-4):
- Interactive Canvas: Nodes (green/red boxes) represent chemical compounds, while directed arrows represent enzymatic catalytic steps. The queried node is highlighted in red.
- Edge Details: Each directed edge is labeled with the catalyzing P450 isoform(s). Clicking on an edge opens a pop-up redirecting to specific detailed records.
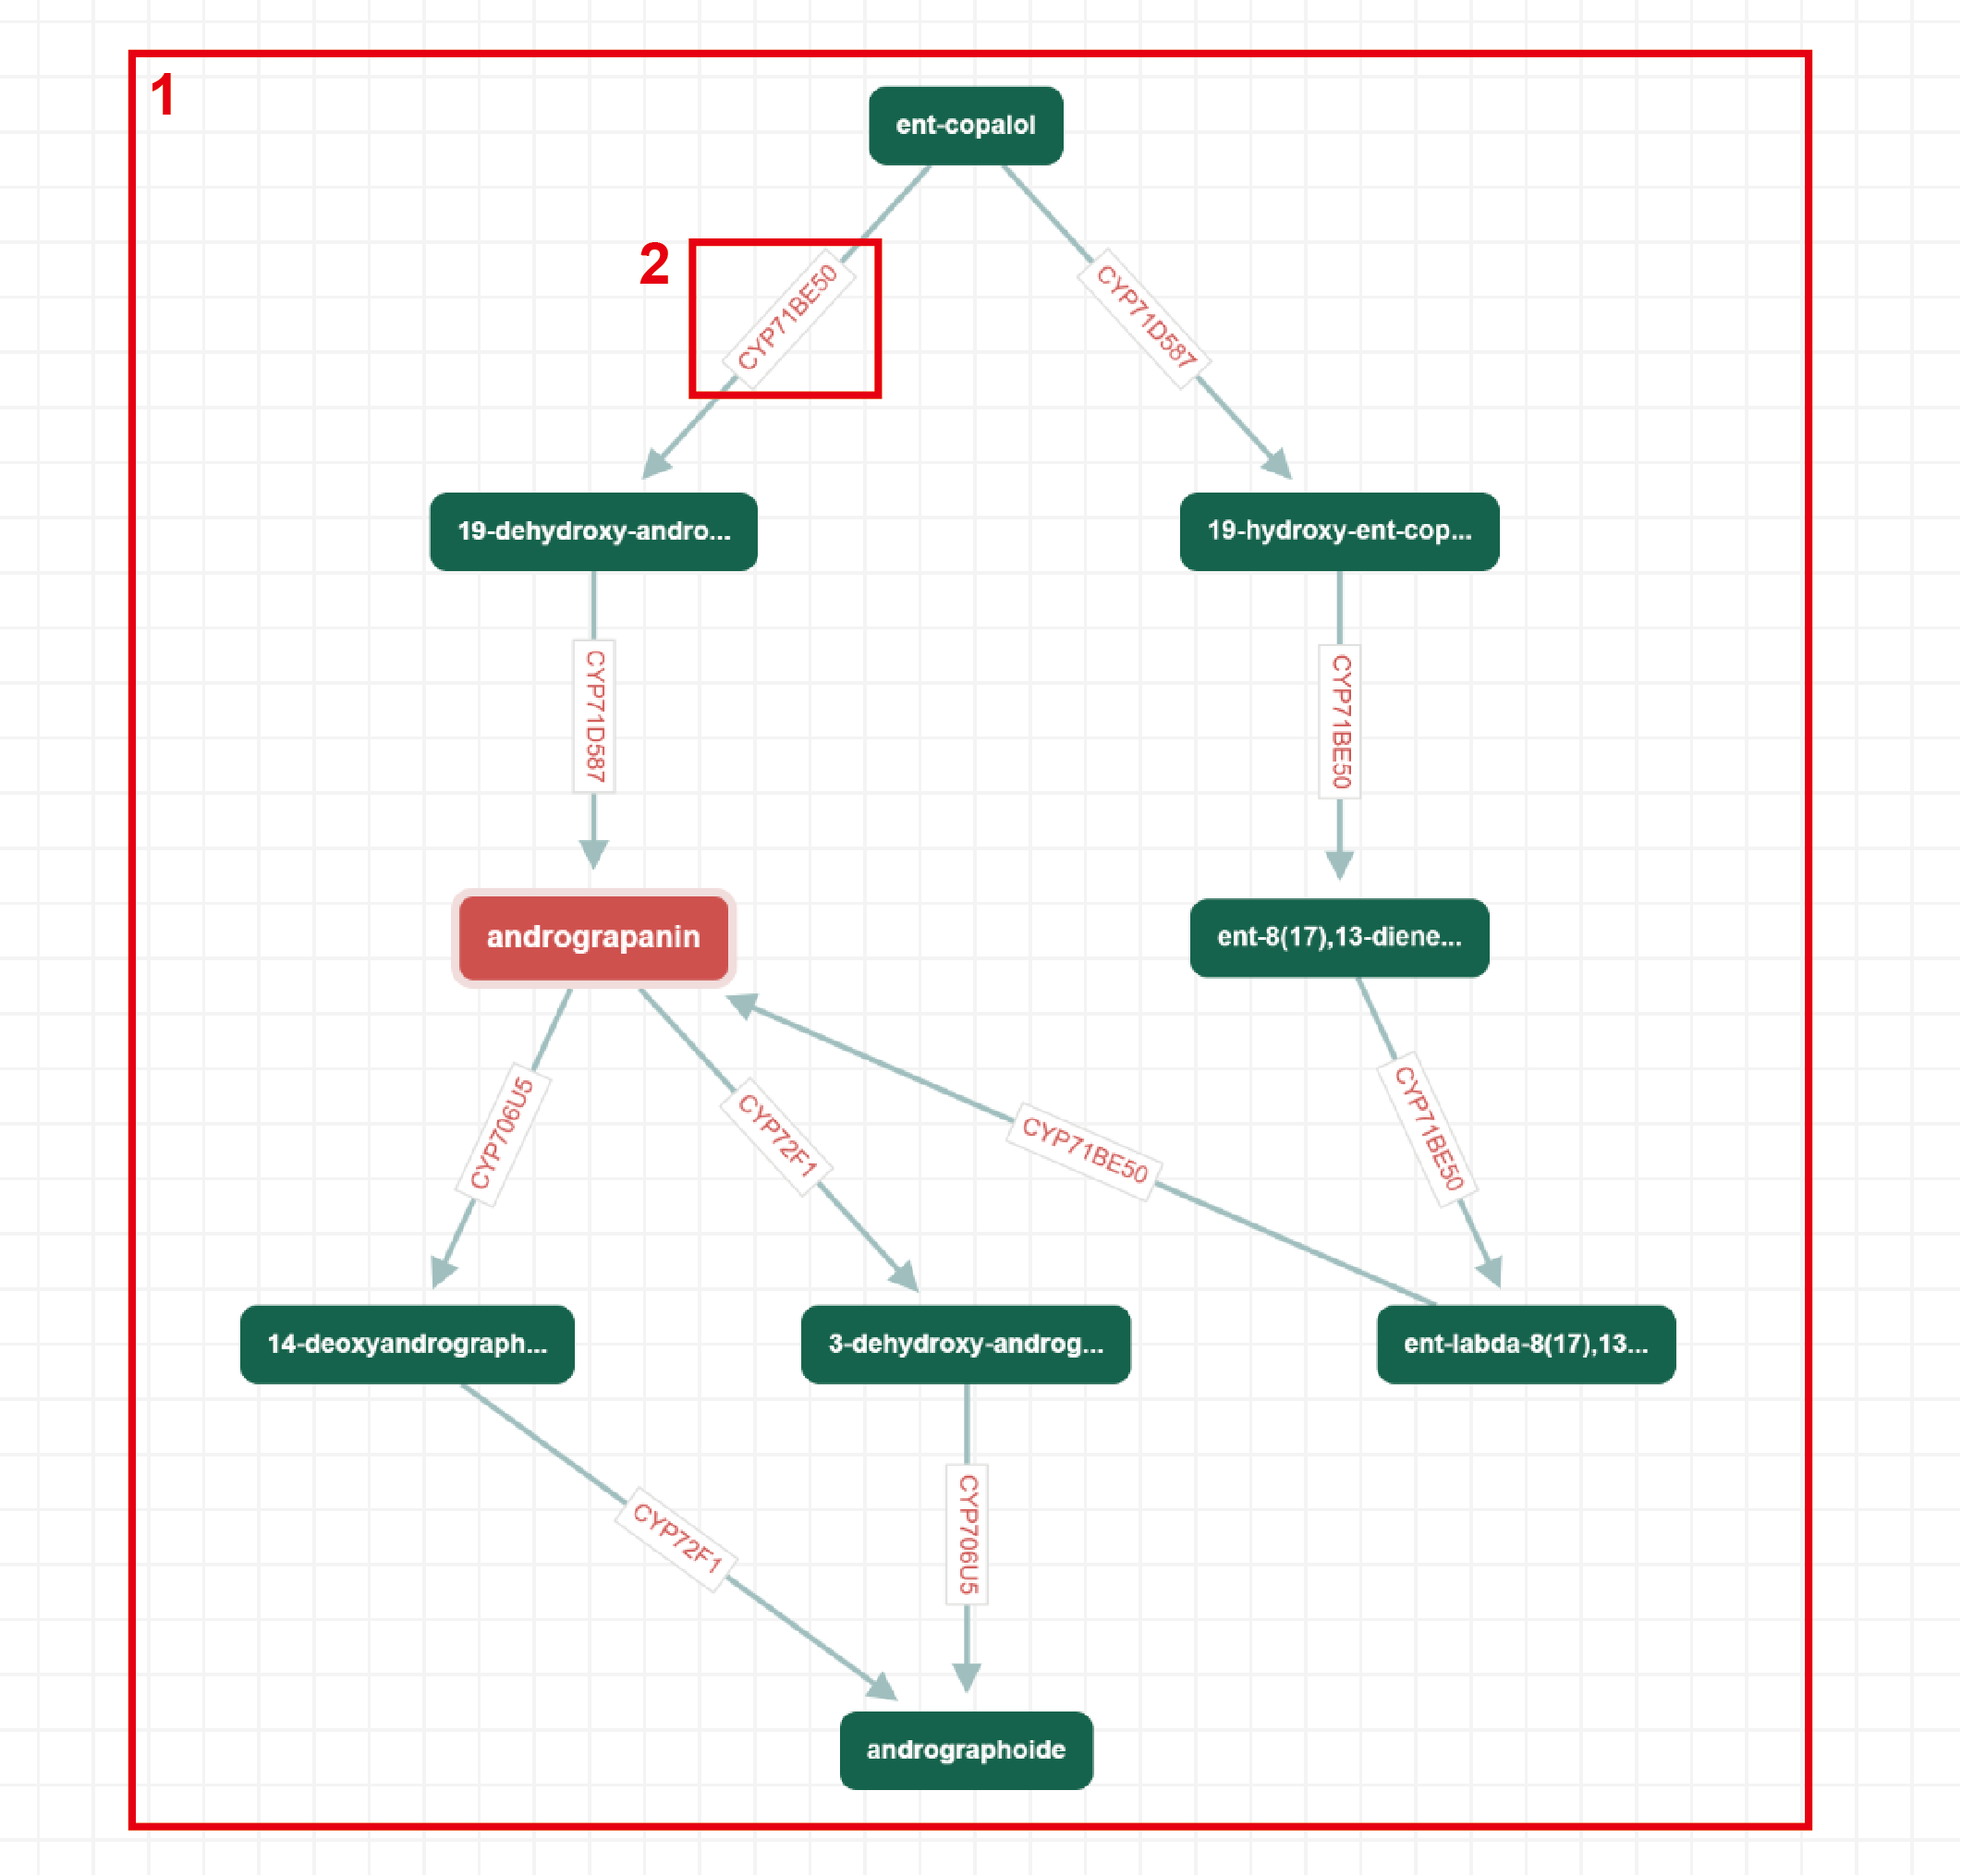
Fig 6-4
P450Rdb v2.0 integrates an advanced deep learning framework (combining ESM protein language models, GNN, and XGBoost) to predict potential catalytic interactions.
1. Setting up the Prediction (Fig 7-1):
- Protein Input (Box 1): Paste a raw amino-acid sequence or enter a valid UniProt ID. UniProt IDs are resolved to amino-acid sequences through the UniProt REST API before prediction.
- Substrate Input (Box 2): Enter the SMILES string or sketch the target compound.
- Click "Start Prediction" to initiate the AI inference process (may take a few minutes).
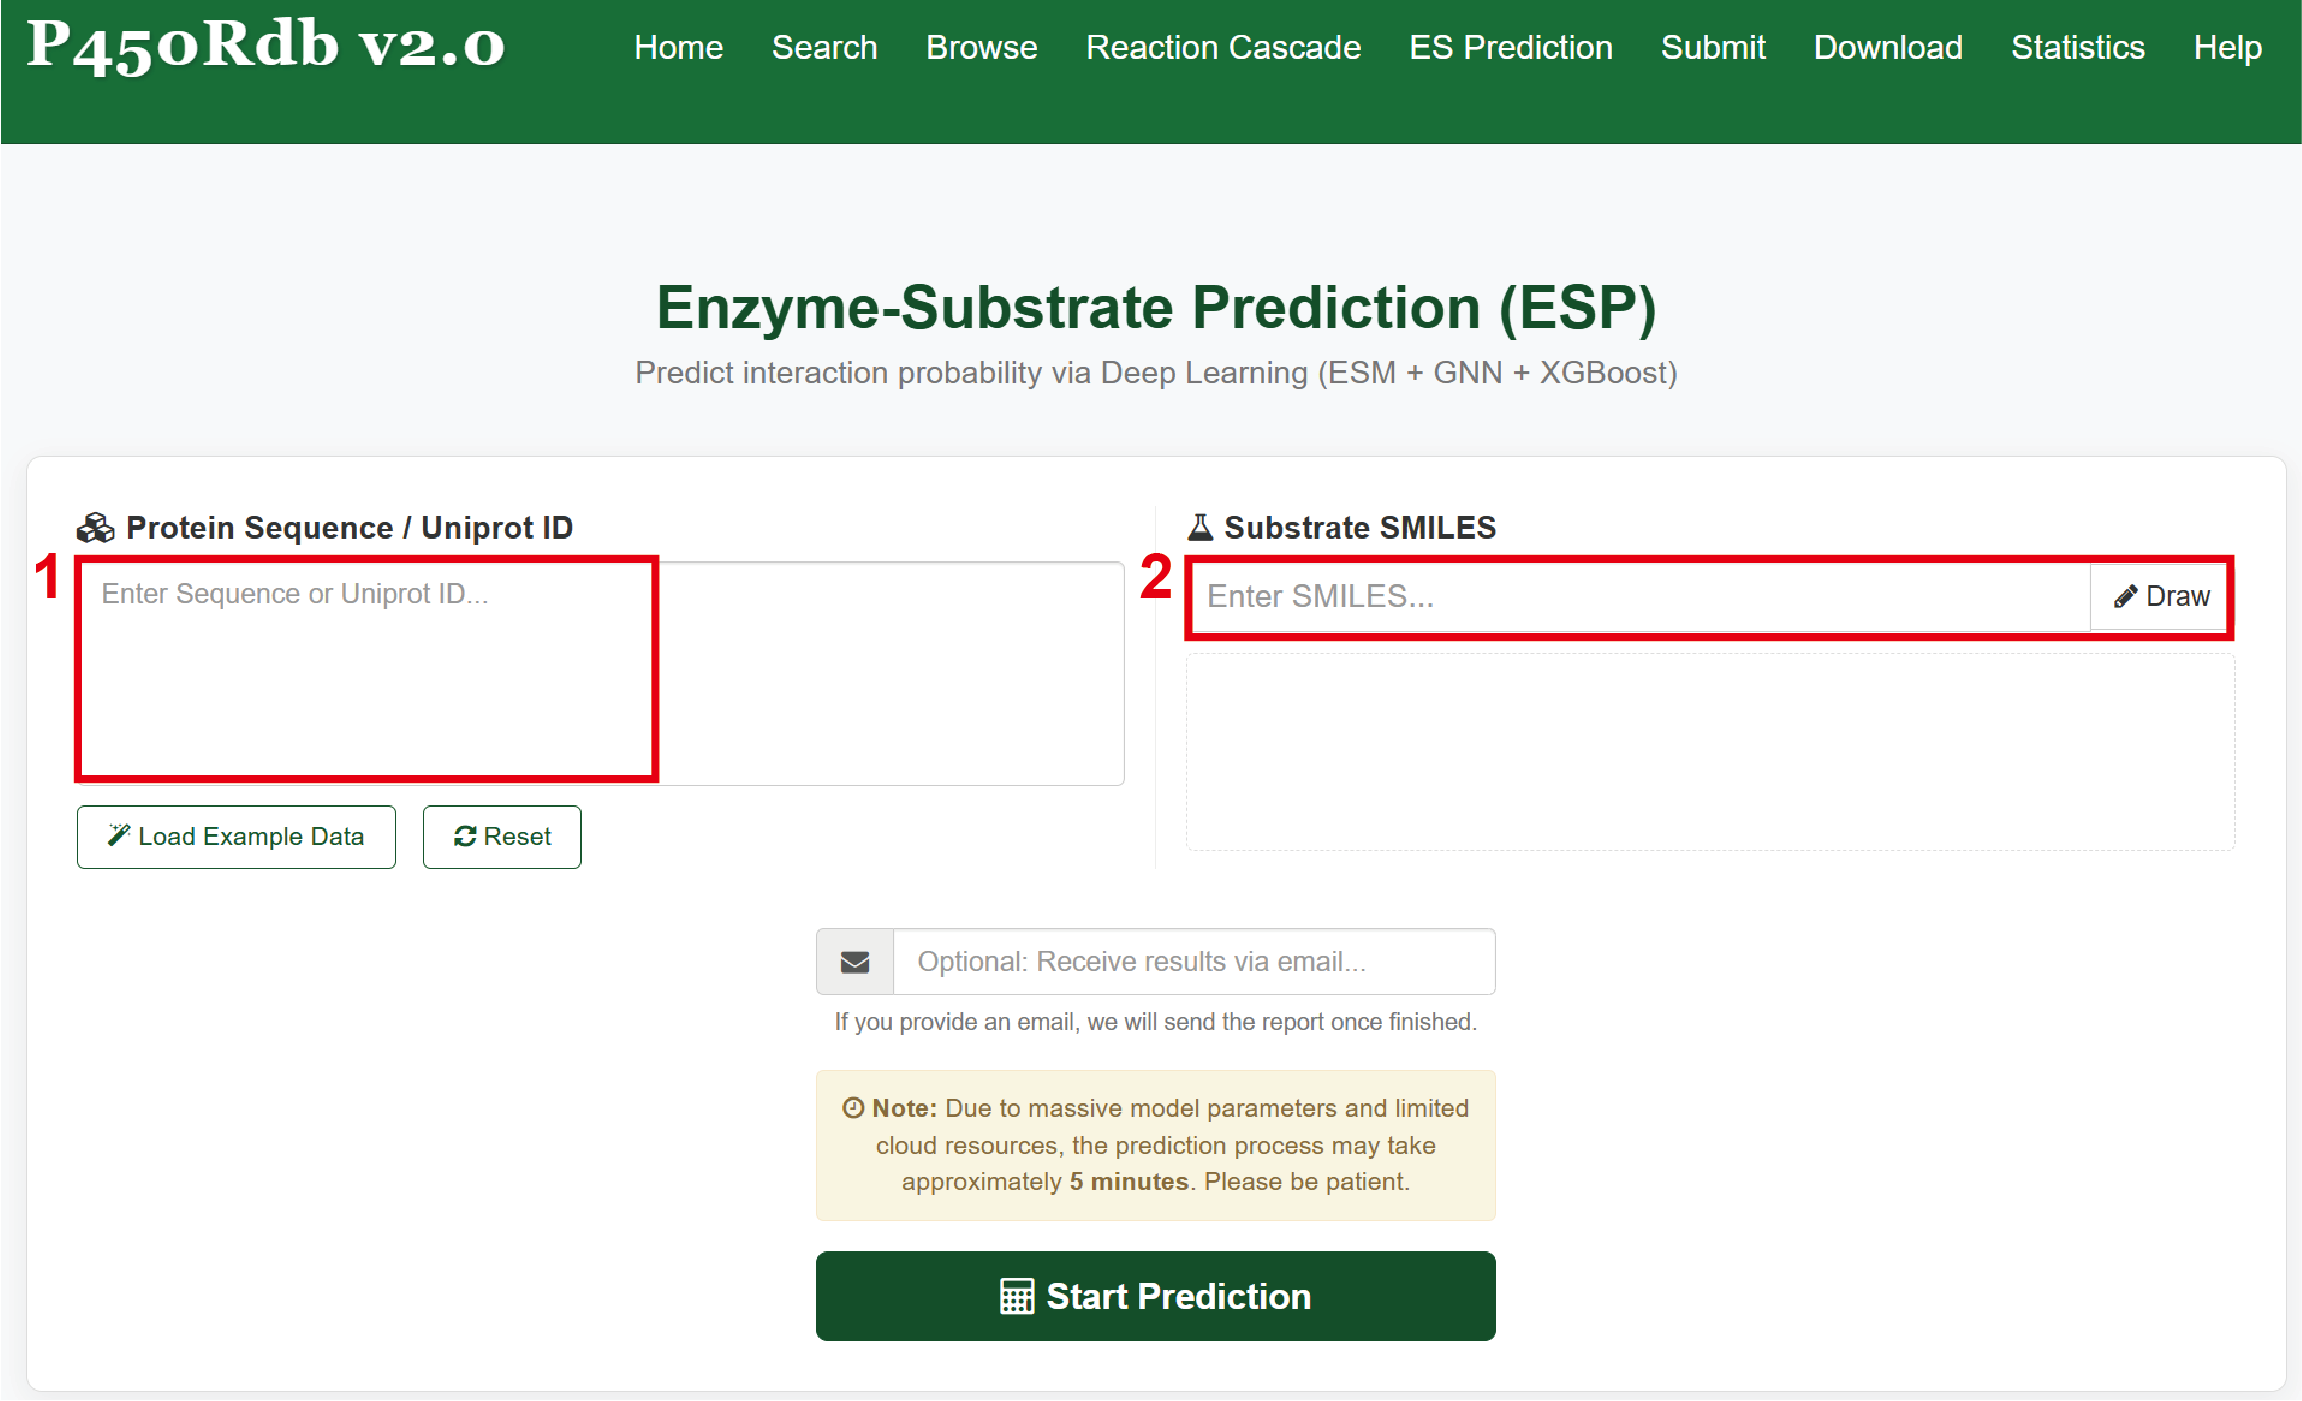
Fig 7-1
2. Interpreting Prediction Results (Fig 7-2):
- Interaction Probability (Box 1): A score closer to 1.0 indicates a highly probable enzyme-substrate catalytic interaction.
- Model Interpretation / SHAP (Box 2): Visualizes which specific features contributed positively (Green) or negatively (Red) to the final prediction score.
- Evidence Support (Box 3): Lists the top 5 structurally similar substrates that have already been experimentally validated in our database to biologically anchor the AI prediction.
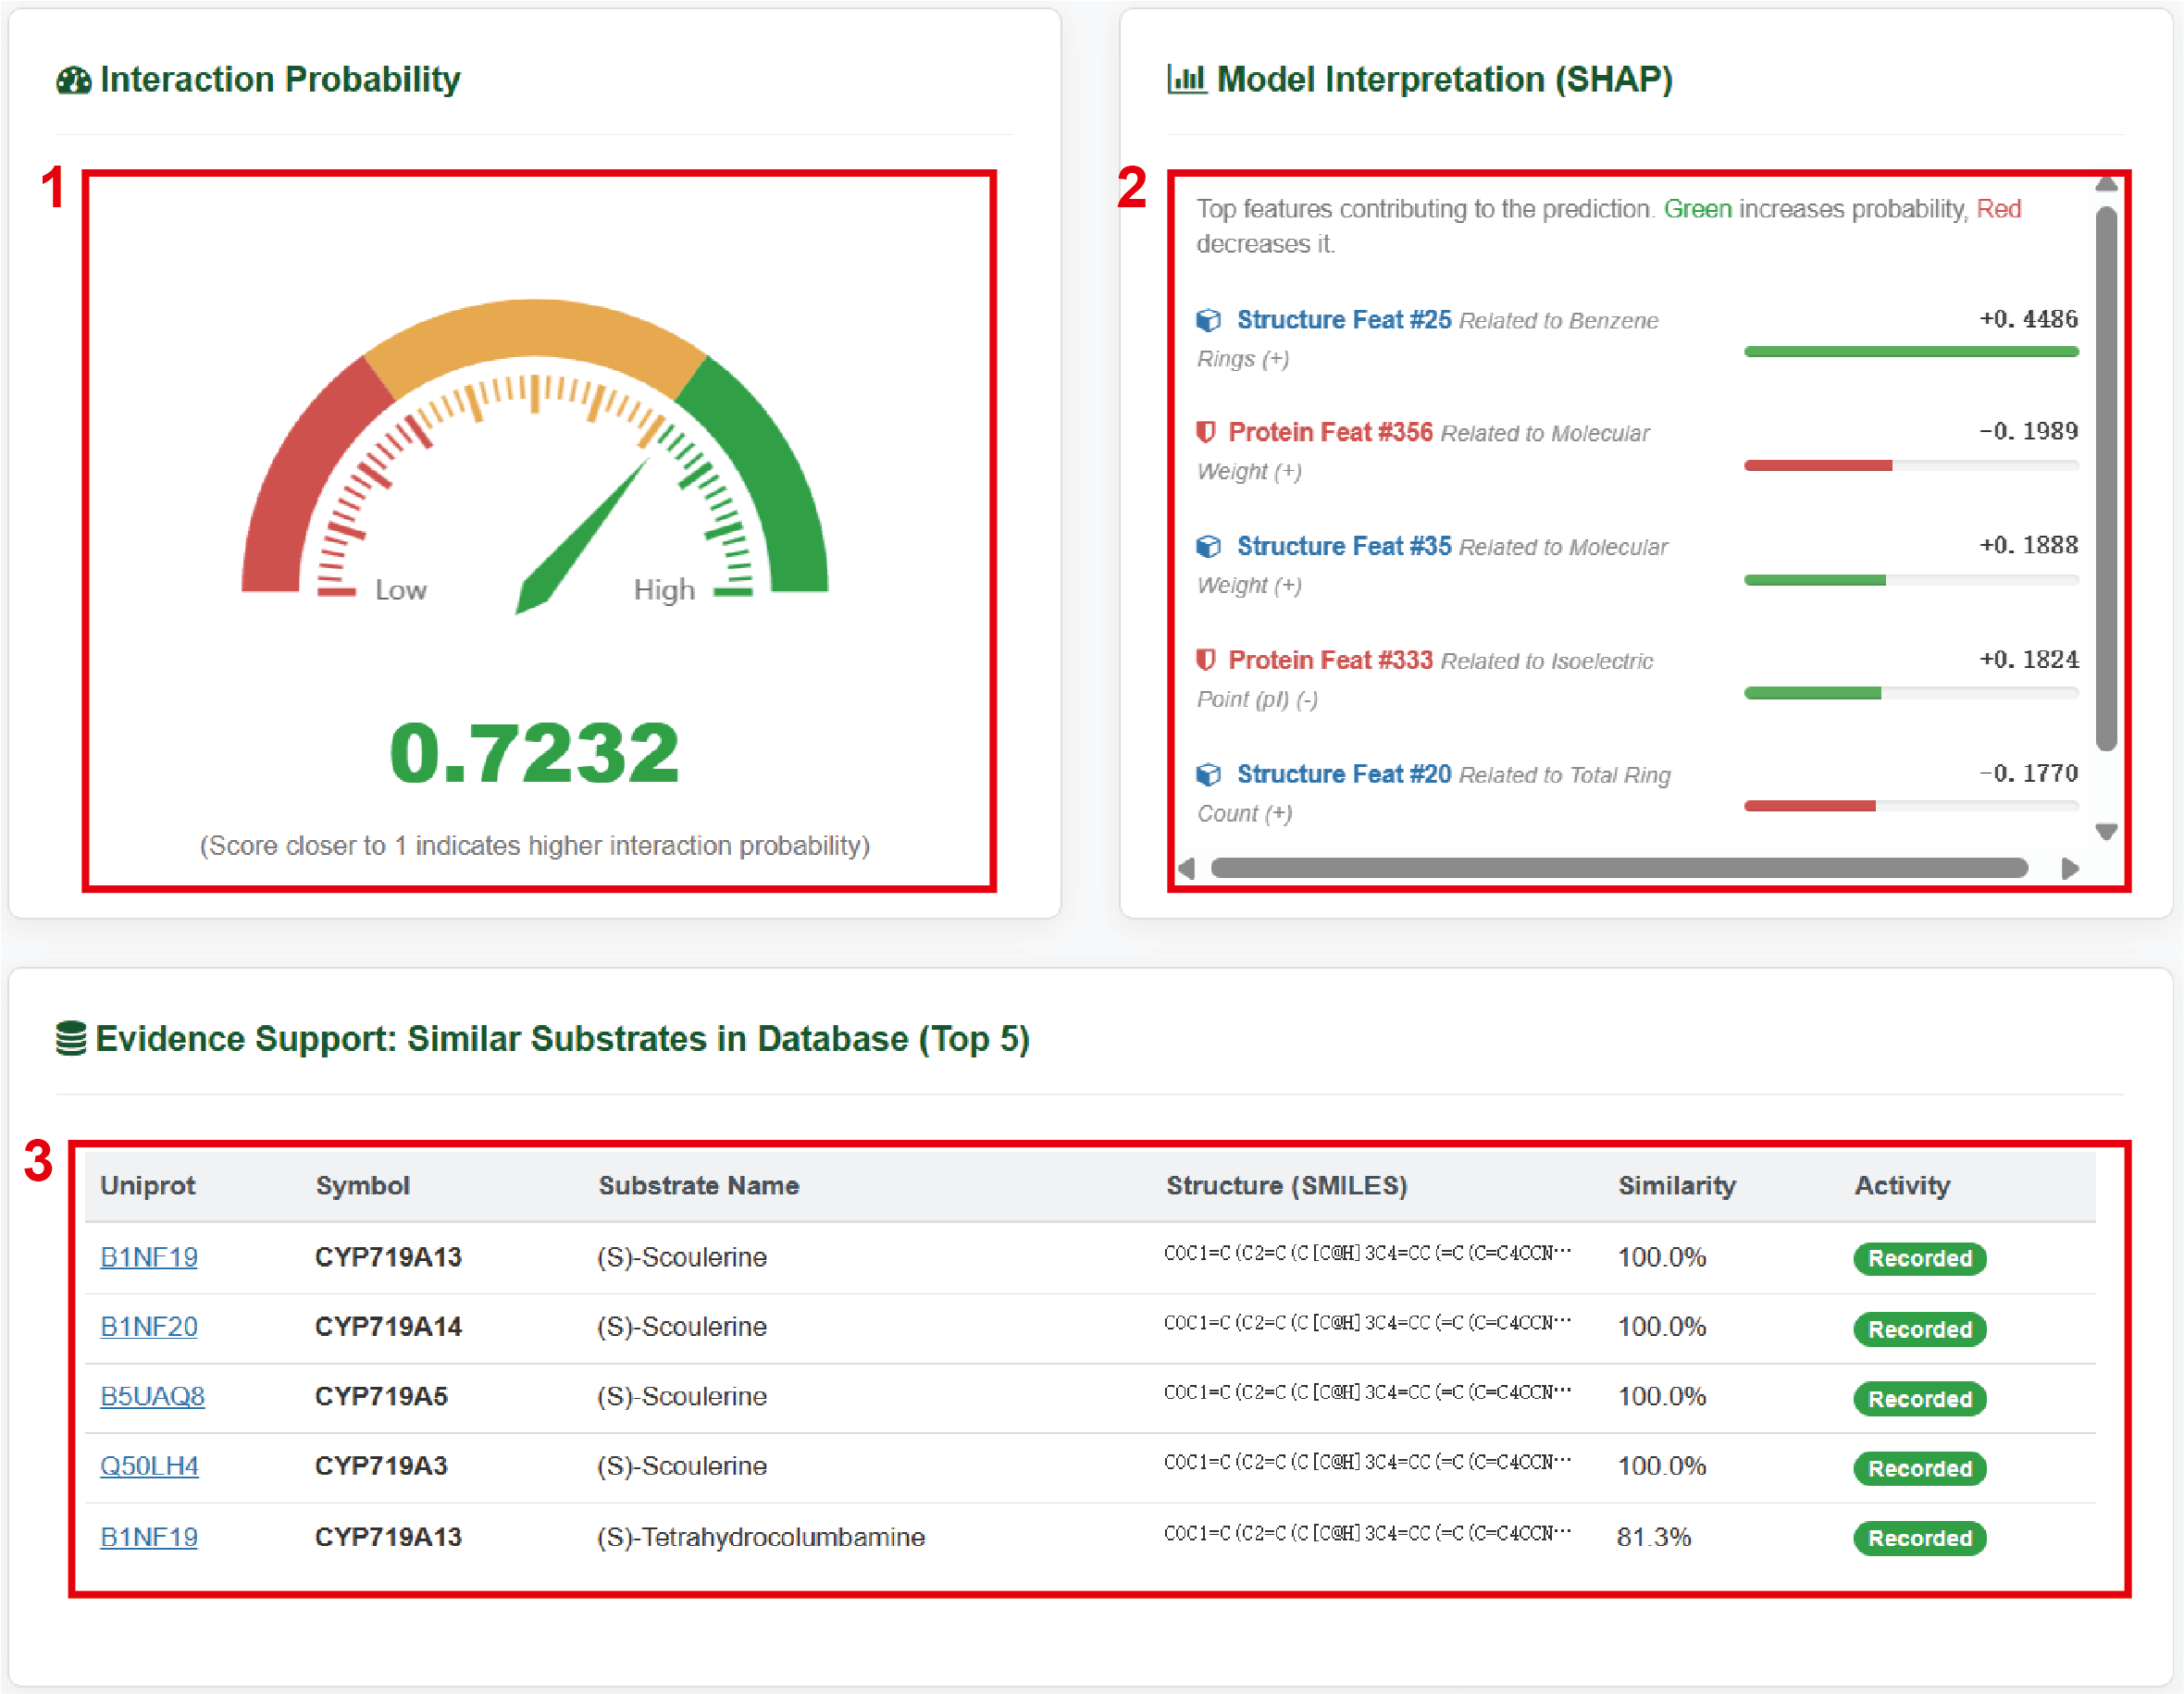
Fig 7-2
P450Rdb provides open access to its meticulously curated datasets, allowing researchers to perform offline bioinformatics mining or model training.
Available Files (Fig 8-1):
- Reactions (.csv): The detail information of all collected reactions.
- P450s (.csv): The detail information of all collected P450s.
- Compounds (.csv): The detail information of all compounds (substrates and products).
- Sequence (.fasta): The sequences of all collected P450s.
- Reaction Cascades (.csv): The detail information of all collected reaction cascades and metabolic networks.
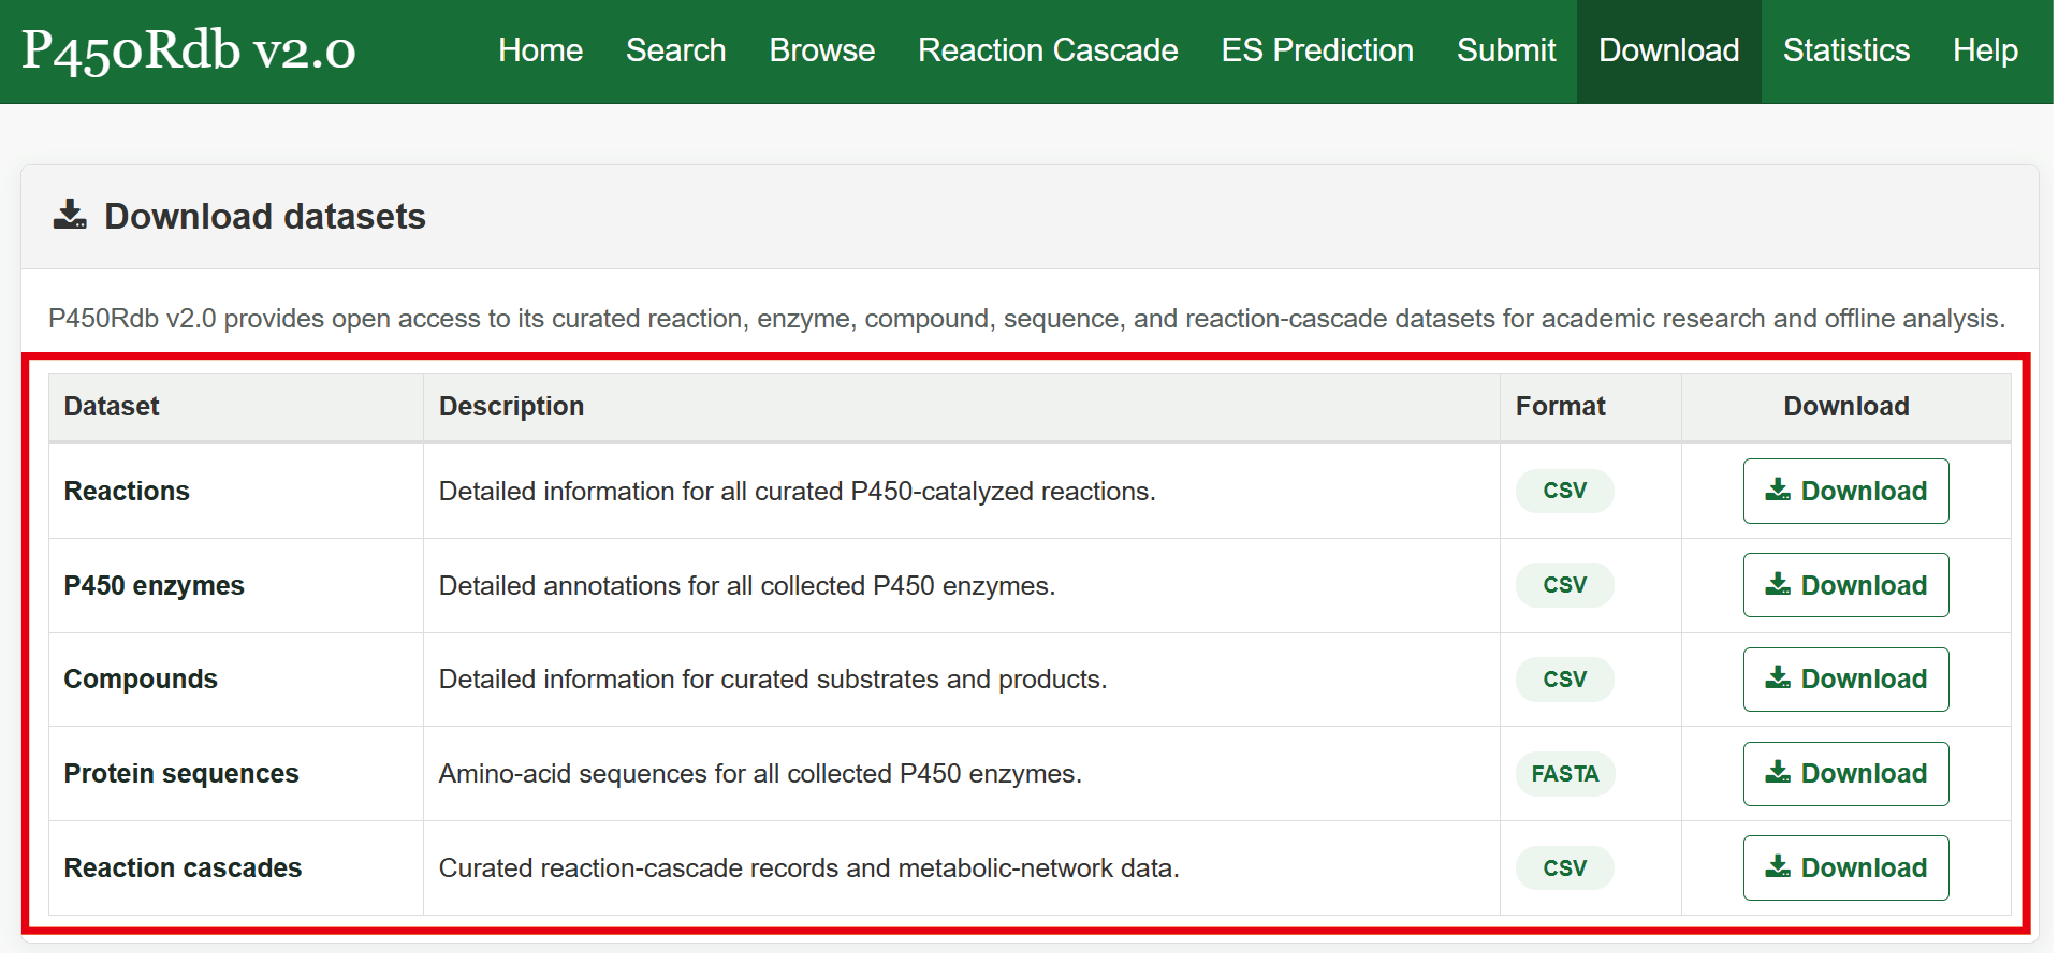
Fig 8-1